Ability Analysis Radial Graph – Business Introduction and Market Analysis
RJ0300033_9
- Last Update 04/27/2025
- File Size 1.4MB
- # of Slides 2
- File Format PPTX
- Slide Ratio 16:9
- Color
Keywords
- #Content-Based Slides
- #Design-Based Slides
- #Business Introduction
- #Market and Competitor Analysis
- #Graph
- #Technological Status
- #Market Analysis
- #Other
- #Radar Chart Spider Chart
- #Silhouette
- #16:9
- #radial graph PowerPoint
- #ability analysis slide template
- #5-axis radar chart
- #competency evaluation presentation
- #competitive analysis diagram
About the Product
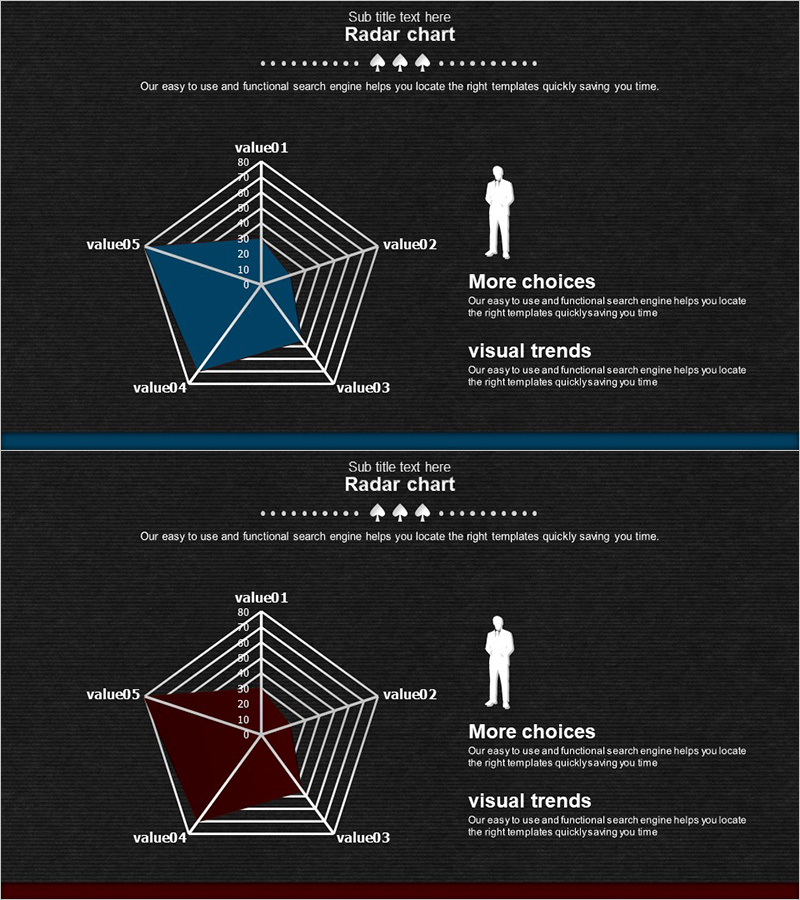
A PowerPoint slide that visualizes five dimensions of ability and competency using a radial chart design. Set against a dark background with white gridlines and blue or wine-colored fills, this slide clearly represents comparative data across multiple axes. The concentric grid scale (0–80) enables quantitative evaluation at a glance, making it ideal for business introductions, market analysis, competitive benchmarking, and organizational capability assessments. The 2-slide set allows you to compare different datasets side by side.
Usage Points
-
Main Usage
Compare and analyze multidimensional capabilities of organizations, products, or competitors, identifying strengths and weaknesses at a glance. Input specific axis labels and numeric values (0–80 scale) to instantly create a decision-support visualization.
-
How to Use
Replace value01–value05 labels with organization names, product names, or evaluation criteria. Enter numeric values within the 0–80 range. Use the blue and wine color fills to compare two entities simultaneously, or use a single color to emphasize one dataset.
-
Recommended For
Recommended for organizational capability assessments in strategy and business planning presentations, competitive analysis in marketing proposals, feature comparisons in product introductions, and market positioning explanations in investor pitch decks.
-
Slide Structure
2-slide set. Each slide features a central pentagon node with five axes radiating outward, and concentric gridlines marking the 0–80 scale at 10-unit intervals. Data regions are filled with blue or wine-colored polygons, with a text area on the right side for additional explanations.
Related Products
-

Online Shopping Mall System Radial Graph – Dynamic Data Visualization
#Business Introduction #Market and Competitor Analysis #Graph
-

Goal Setting & Radial Graph – Intuitive Data Visualization
#Business Introduction #Market and Competitor Analysis #Diagram
-

Battery Shape Vertical Bar Graph – Market Status Analysis
#Business Introduction #Market and Competitor Analysis #Graph
-

Online Shopping Mall Composition Analysis Graph - Business Analysis and Technical Insights
#Business Introduction #Market and Competitor Analysis #Graph
