Market Analysis Bar Graph – Effective Data Visualization
RJ0300031_28
- Last Update 04/26/2025
- File Size 0.7MB
- # of Slides 2
- File Format PPTX
- Slide Ratio 16:9
- Color
Keywords
About the Product
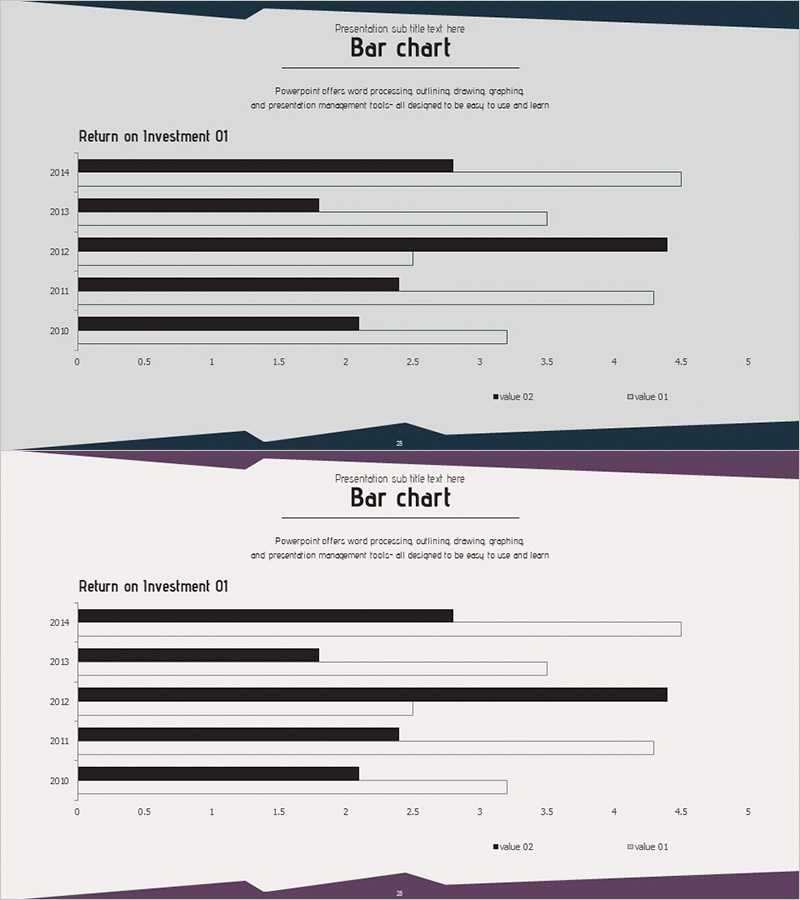
A horizontal bar chart PowerPoint slide optimized for market analysis and financial data comparison. This presentation slide features two data series in black and light gray, displaying Return on Investment (ROI) data across five years from 2010 to 2014 in a side-by-side format. Designed for 16:9 widescreen displays, the slide is ready to use in business presentations and reports. The X-axis ranges from 0 to 5 with 0.5 increments, enabling precise data reading. This standard-format chart is commonly used in corporate reports, marketing plans, business analysis documents, and investor presentations.
Usage Points
-
Main Usage
Compares numerical data across years or categories in a horizontal layout, displaying two or more data series simultaneously. Ideal for showing performance changes over time, departmental performance comparisons, regional sales analysis, and multi-series data visualization.
-
How to Use
Used in executive reports, quarterly performance presentations, investor relations (IR) meetings, and marketing performance analysis documents. Data entry automatically adjusts bar lengths, making updates simple. Colors and legends can be customized to match corporate branding guidelines.
-
Recommended For
Finance teams, executives, marketing departments, and sales teams analyzing and reporting monthly, quarterly, or annual performance. Particularly useful for budget vs. actual analysis, goal achievement rates, competitive benchmarking, and presenting quantitative data clearly to stakeholders.
-
Slide Structure
Two-slide set with identical horizontal bar chart layouts. Each slide displays years (2010–2014) on the Y-axis, numerical values (0–5) on the X-axis, and two data series (value 02 in black, value 01 in light gray) in the legend. Title area at top and data source notation space at bottom.
Related Products
-

Office Supplies Theme Bundle Bar Graph – Market Status Analysis
#Market and Competitor Analysis #Graph #Market Status
-

Visual Trend Presentation Slide with Graphs
#Market and Competitor Analysis #Graph #Market Analysis
-

White Black Bundle Horizontal Bar Graph
#Market and Competitor Analysis #Graph #Market Analysis
-

Cybersecurity Business Market Analysis Graph
#Market and Competitor Analysis #Graph #Competitor Analysis
