Doughnut Chart for Development Status by Field
RJ0300031_24
- Last Update 04/26/2025
- File Size 0.7MB
- # of Slides 2
- File Format PPTX
- Slide Ratio 16:9
- Color
Keywords
About the Product
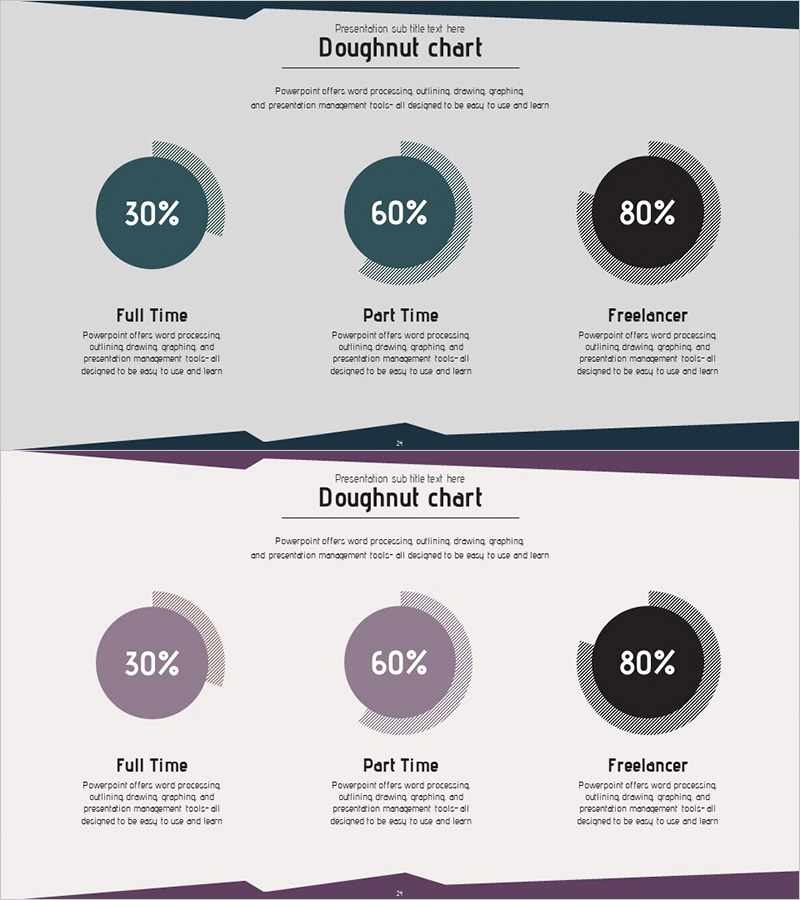
This free PowerPoint slide features three doughnut charts for comparing category ratios at a glance. Perfect for visualizing development status, market share, workforce distribution, and other comparative data with a professional dark teal and purple color scheme. Simply replace the text labels and percentages to create a polished presentation slide ready for business reports, proposals, and pitch decks. The slide is fully editable and requires minimal effort to customize, making it ideal for professionals who need quick, professional-quality data visualization. Explore more graph and chart slide templates on GoodPello for comprehensive presentation solutions.
Usage Points
-
Main Usage
Visualize and compare ratios, percentages, and distributions across three categories using doughnut charts. Ideal for presenting development status, market share, workforce composition, customer segments, and other comparative metrics in business presentations.
-
How to Use
Replace the category labels (Full Time, Part Time, Freelancer) and percentages (30%, 60%, 80%) with your own data. Update the descriptive text below each chart as needed. The color scheme can be kept as-is or customized to match your presentation branding.
-
Recommended For
Business professionals, project managers, marketers, and analysts who need to present comparative data in business plans, reports, investment pitches, marketing strategies, and product presentations. Suitable for anyone seeking quick, professional data visualization without design expertise.
-
Slide Structure
Single-slide layout with three doughnut charts arranged horizontally. Each chart includes a label area and descriptive text field below. Two color versions (dark teal and purple) are included for flexible design matching.
Related Products
-

Market Analysis Graph – Harmony of Pink and Bluegreen
#Free Graphs
-

Data Visualization with Bar Charts – Presentation for Efficient Choices
#Free Graphs
-

Tree Yellow Purple Area Chart – Innovation in Data Visualization
#Free Graphs
-

Vertical Bar Chart Visualizing Candidate Values – Trends and Choices
#Free Graphs
