Free Graphs
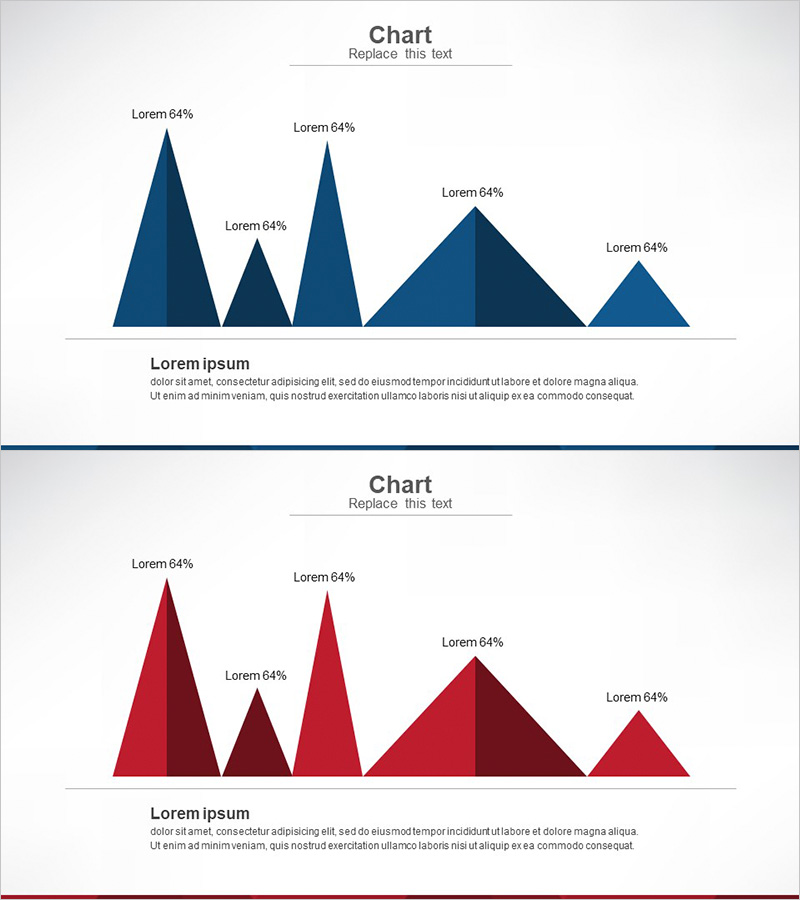
Triangular Shaped Graph for Market Share Analysis – Intuitive Data Communication
RJ0300024_10
- Last Update 12/21/2025
- File Size 0.2MB
- # of Slides 2
- File Format PPTX
- Slide Ratio 16:9
- Color
Keywords
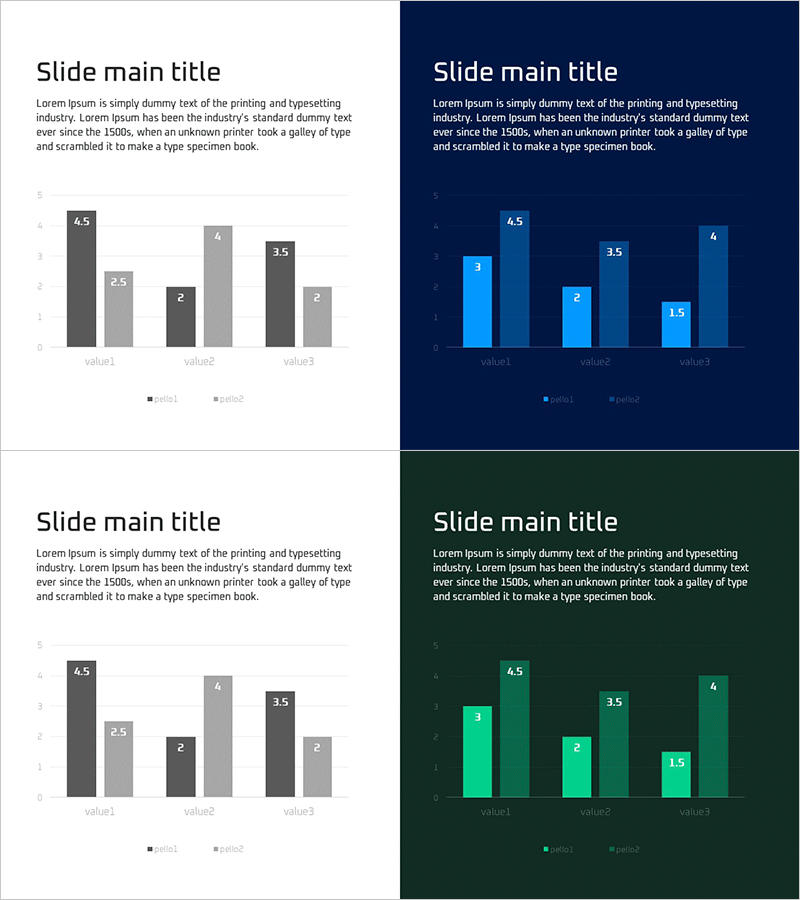
About the Product
This slide features a triangular shaped graph that clearly conveys market share data. The clean and organized design facilitates easy data comparison, allowing users to effectively understand information. The harmonious color scheme of blue and red conveys both trust and passion, with each graph distinctly representing corresponding values at the top. This slide is suitable for market and competitor analysis reports, making it useful for comparing and analyzing market shares within a specific market. Text and data are easily replaceable, with an overall editing difficulty rated as 'easy', enabling quick integration into various presentations.
Related Products
-
Competitive Advantage Analysis Bar Chart – Data Visualization
#Free Graphs
-
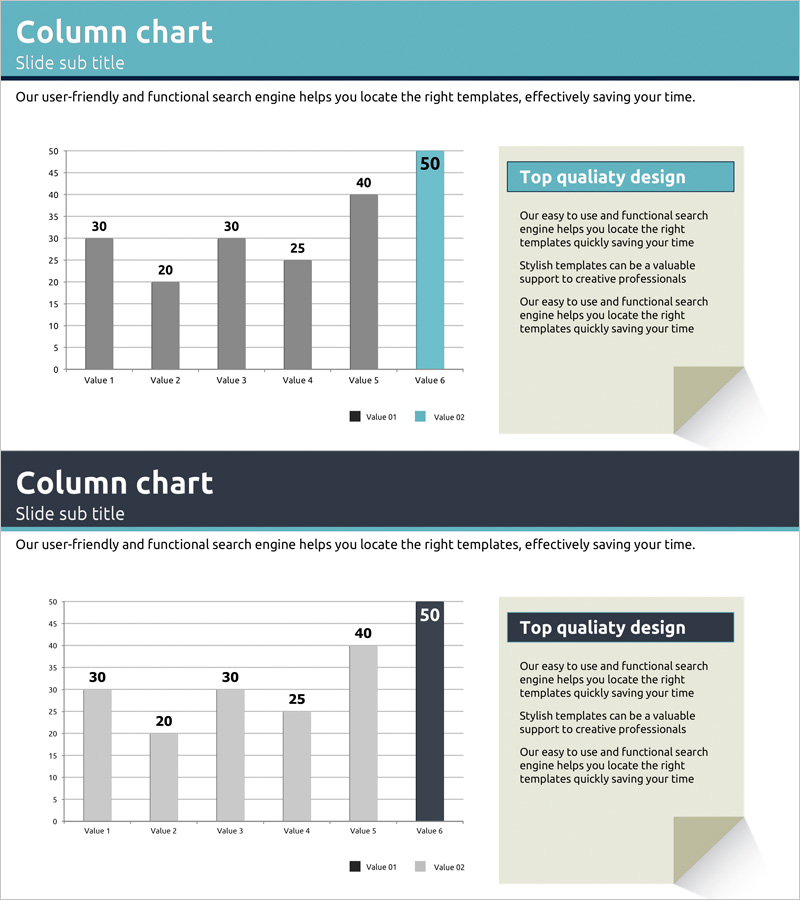
Column Chart for Market Status and Future Prospects – Harmony of Blue and Navy
#Free Graphs
-
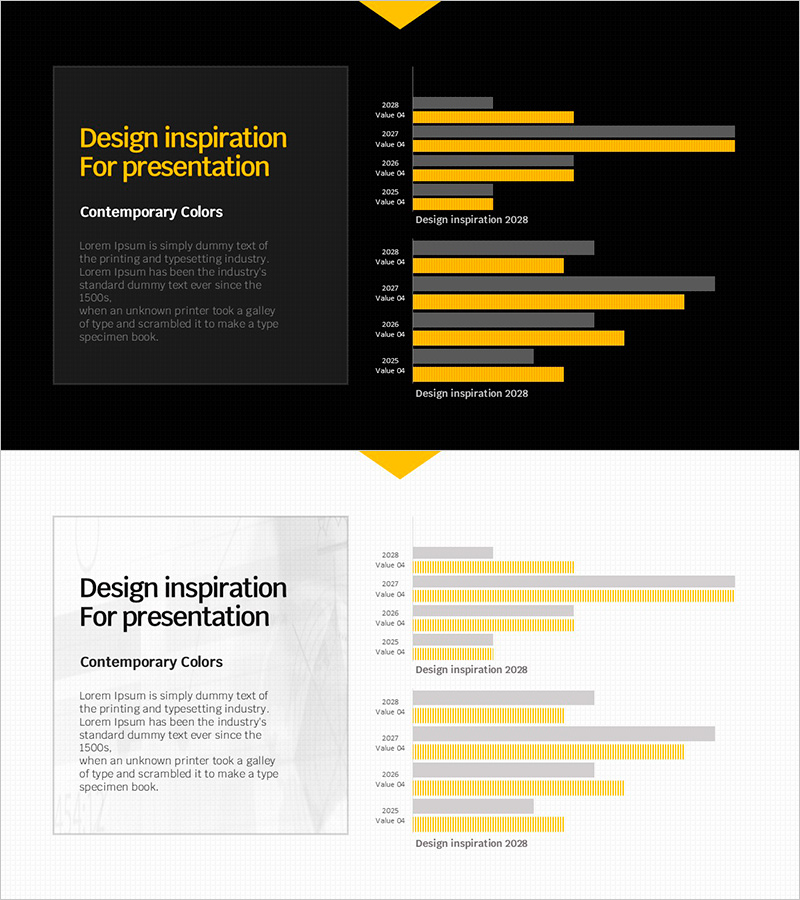
Visualizing 2028 Design Inspiration with Bar Graphs - Contemporary Colors
#Free Graphs
-
Comparative Analysis Bar Graph – Market and Competitor Analysis
#Free Graphs
