Market and Competitor Analysis
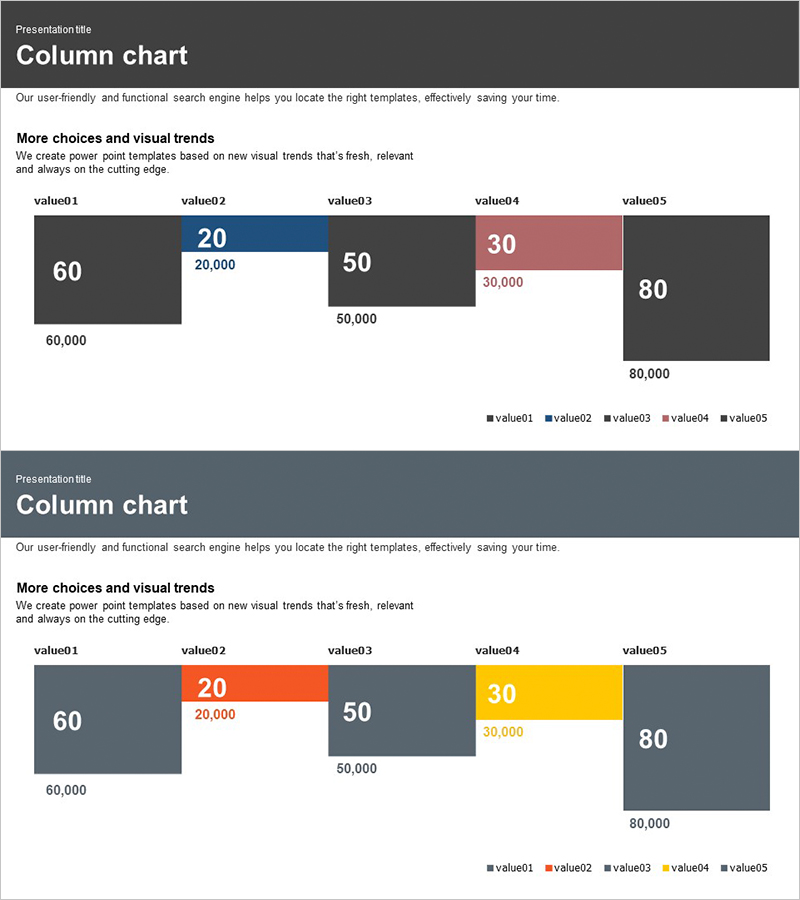
Market Analysis Rectangular Area Graph – Insights for Data Interpretation
RJ0300009_11
- Last Update 12/21/2025
- File Size 0.2MB
- # of Slides 2
- File Format PPTX
- Slide Ratio 16:9
- Color
Keywords
About the Product
This slide utilizes a rectangular area graph for market analysis, visually conveying essential data insights. With a practical and intuitive design, it effectively highlights the importance and variability of each data point. The harmonious color scheme of black, dark blue, and gray presents a professional and stable image. This template is ideal for business reports, market research presentations, and project proposals. Additionally, each element is easily modifiable, allowing users to customize data as needed. The editing difficulty is rated as 'medium', making it suitable for a wide range of users.
Related Products
-

Surveys on Crisis and Help – Intuitive Data Visualization
#Market and Competitor Analysis #Graph #Customer Analysis
-

Visualizing Causes of Workplace Stress with Horizontal Bar Graph
#Market and Competitor Analysis #Graph #Customer Analysis
-
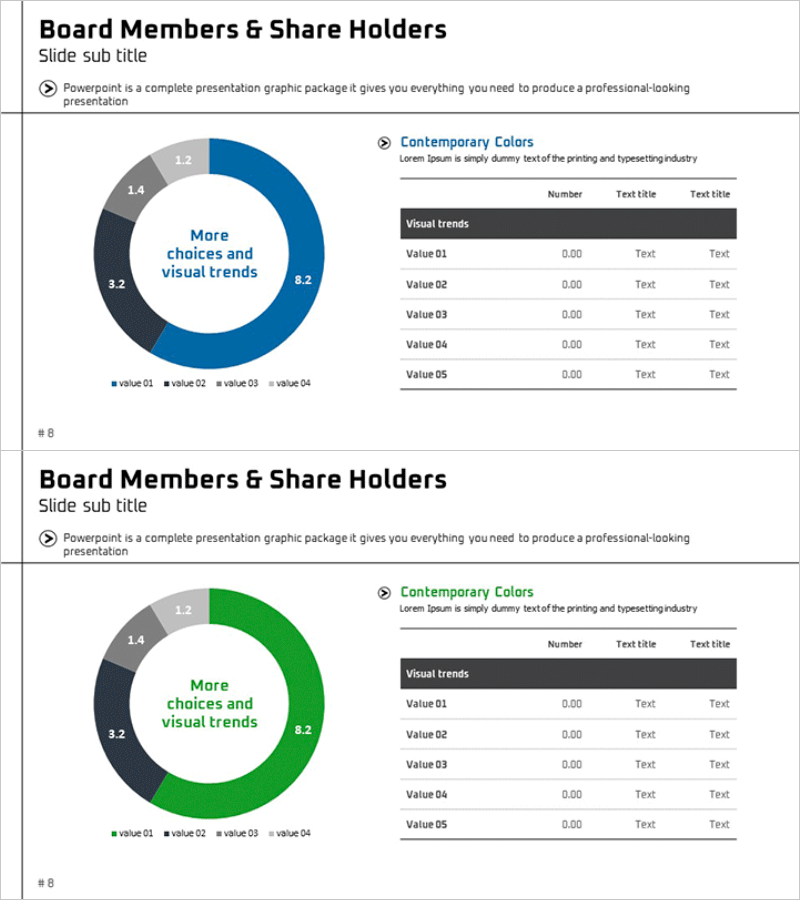
Shareholder Status Analysis Donut Chart – Insights and Analysis
#Company Introduction #Market and Competitor Analysis #Diagram
-
City Theme Market Share Graph – Business Data Visualization
#Product/Service #Market and Competitor Analysis #Graph
