
Business Introduction
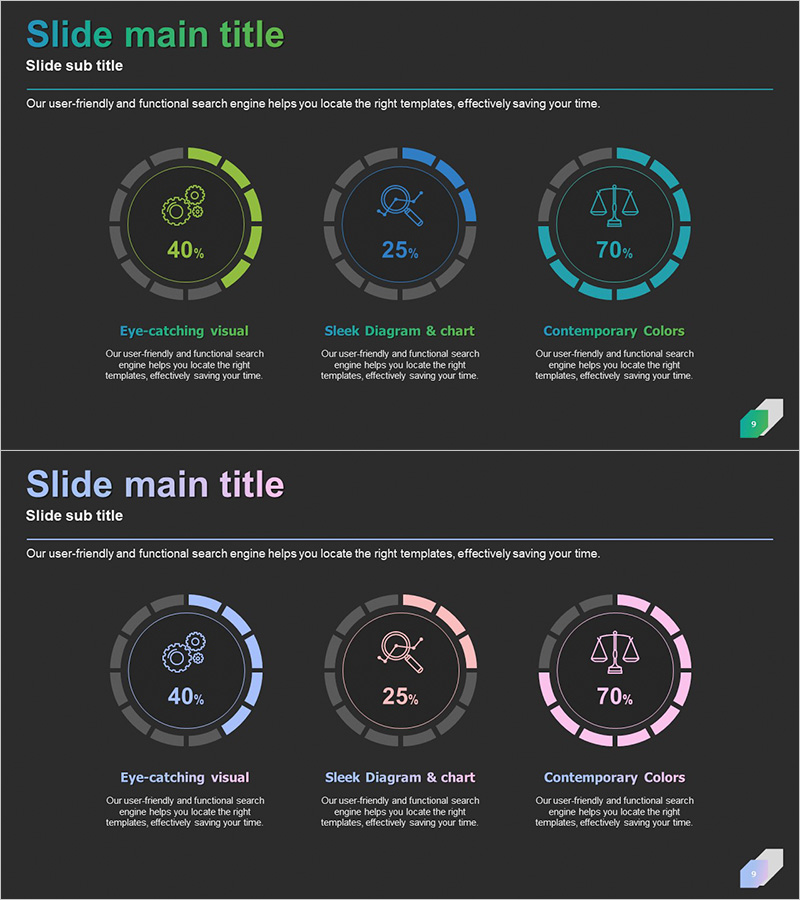
Circular Gradient Wide Template Donut Chart – Business Introduction and Revenue Model
RJ0200056_9
- Last Update 12/21/2025
- File Size 2.6MB
- # of Slides 2
- File Format PPTX
- Slide Ratio 16:9
- Color
Keywords
About the Product
This PowerPoint features a circular gradient design donut chart to effectively visualize business introductions and revenue models. With a color gradient to provide striking data, it draws viewer attention through vibrant red and strong contrast. The slide adopts an infographic style, visually presenting data proportions and information concisely. Ideal for effectively conveying business status, technological understanding, and revenue models, it’s suitable for presentations targeting investors and professionals. Overall, this slide has a very intuitive editing structure, making modifications easy, with a moderate editing difficulty level.
Related Products
-
Business Development Status Analysis Graph – Key Insight Visualization
#Product/Service #Market and Competitor Analysis #Graph
-
Key Customer Gender Analysis Chart – A Step Towards Understanding Customers
#Company Introduction #Graph #Other
-
Stylish Comparative Column Graph – Market Status and Performance Comparison
#Market and Competitor Analysis #Financial Plans and Performance #Graph
-
Graph for Economic Growth and Competitive Advantage Visualization
#Business Promotion Strategy #Market and Competitor Analysis #Graph
