Key Customer Gender Analysis Chart – A Step Towards Understanding Customers
RM0300012_19
- Last Update 02/10/2025
- File Size 1.3MB
- # of Slides 2
- File Format PPTX
- Slide Ratio 16:9
- Color
Keywords
- #Content-Based Slides
- #Design-Based Slides
- #Company Introduction
- #Graph
- #Other
- #Business Areas
- #Customers and Partners
- #Horizontal Bar
- #Horizontal Bar Chart
- #Silhouette
- #16:9
- #gender analysis chart PowerPoint
- #customer ratio silhouette slide
- #gender comparison presentation
- #customer segmentation template
- #business data visualization slide
About the Product
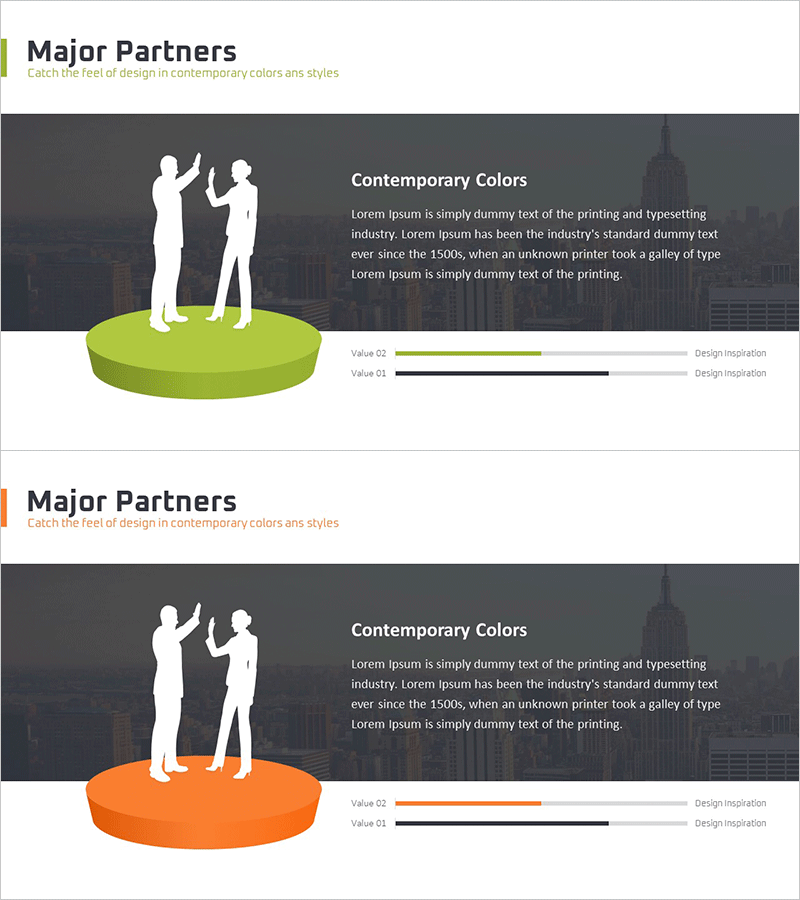
A PowerPoint slide deck featuring silhouette-based gender comparison charts for intuitive customer ratio visualization. Male and female silhouettes are positioned on circular platforms in lime green and orange to distinguish gender-based analysis data at a glance. Set against an urban skyline backdrop, the design conveys a contemporary business atmosphere while horizontal bar graphs supplement numerical comparisons. This 2-slide presentation template is ready to use for diverse customer segmentation presentations and market analysis reports.
Usage Points
-
Main Usage
Visually analyze and communicate customer base gender distribution. Silhouette shapes and color contrast clearly distinguish male and female customer proportions, supporting target audience understanding for marketing strategy development.
-
How to Use
Insert into marketing plans, customer analysis reports, and business proposals within customer understanding sections. Add numerical data to silhouette areas or include legends for specific customer statistics. Customize background colors and text to match company branding guidelines.
-
Recommended For
Marketing managers, sales planning teams, market research analysts, and executive reporting specialists. Particularly effective for organizations requiring gender-based customer segmentation, targeted marketing strategy development, and enhanced customer insight communication.
-
Slide Structure
2-slide layout. Each slide features a circular platform in lime green or orange with two silhouettes (male and female), accompanied by two horizontal bar graphs (Value 01 and 02) on the right for numerical comparison. Dark gray background with urban skyline imagery reinforces business context and professional tone.
Related Products
-

Consumer Analysis Report Chart – Understanding Your Customers
#Company Introduction #Market and Competitor Analysis #Diagram
-

Human Head Structure Diagram – Simple and Intuitive Visualization
#Company Introduction #Business Introduction #Diagram
-

People Puzzle Structure Diagram – Effective Business Introduction
#Company Introduction #Business Introduction #Diagram
-

Silhouette Diffusion 3D Diagram – Dynamic Business Structure Representation
#Company Introduction #Business Introduction #Diagram
