
Technology Sector
Paint Splash Radial Chart Template – Innovation and R&D
RJ0200040_14
- Last Update 12/21/2025
- File Size 3.9MB
- # of Slides 2
- File Format PPTX
- Slide Ratio 16:9
- Color
Keywords
About the Product
This template features a visually stunning radial chart designed with a paint splash effect to present data captivatingly. The harmonious blend of red and blue captivates the audience's attention, maximizing the impact of information delivery. Ideal for various fields such as R&D and innovative technology, this template is particularly suited for project presentations or technical reports. Its luxurious and modern layout leaves a professional and trustworthy impression on the audience. Text and data input are easy, with editing difficulty rated as 'moderate', allowing for seamless application across a variety of presentations.
Related Products
-
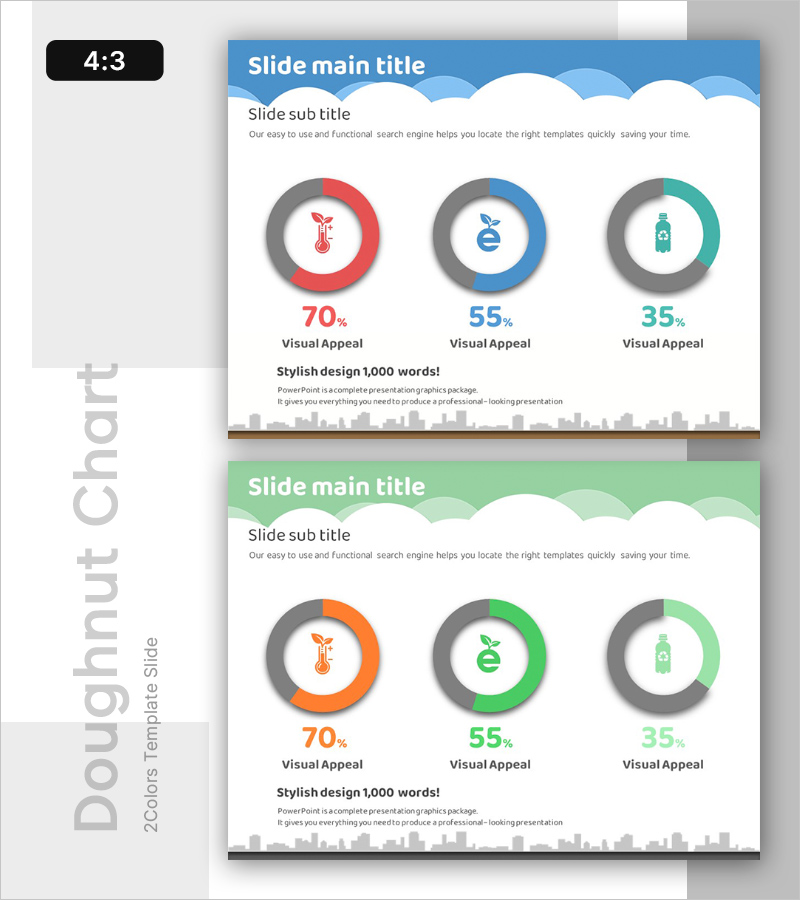
Eco-friendly Donut Graph Analysis – Insights on Market Trends
#Market and Competitor Analysis #Graph #Market Status
-
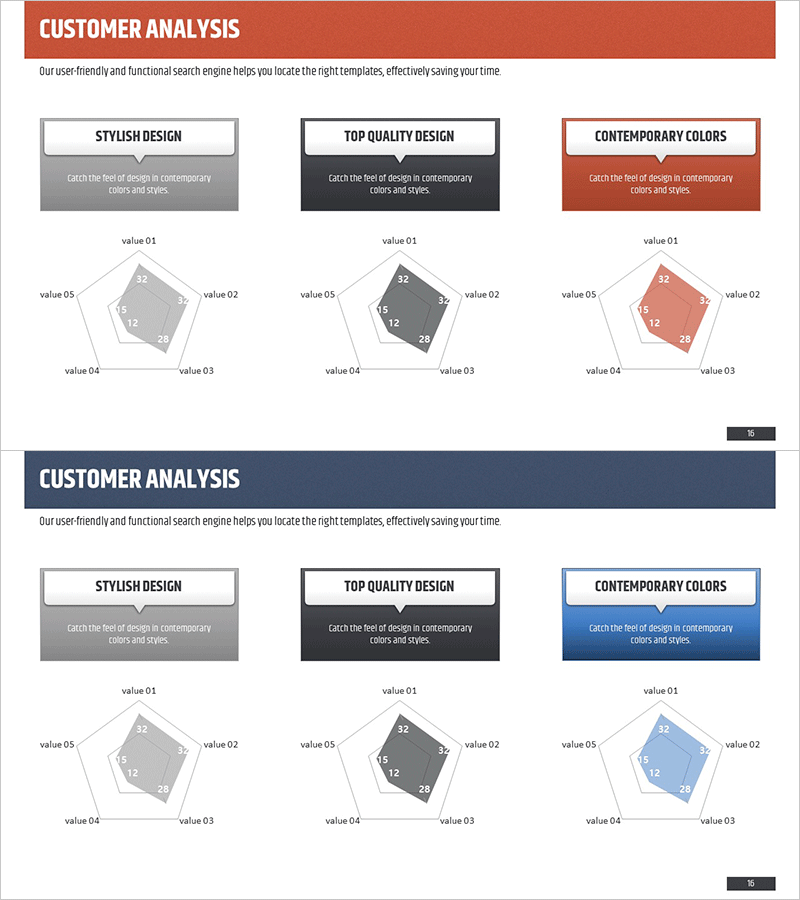
Customer Analysis Radial Graph – Intuitive Data Visualization
#Business Introduction #Market and Competitor Analysis #Diagram
-
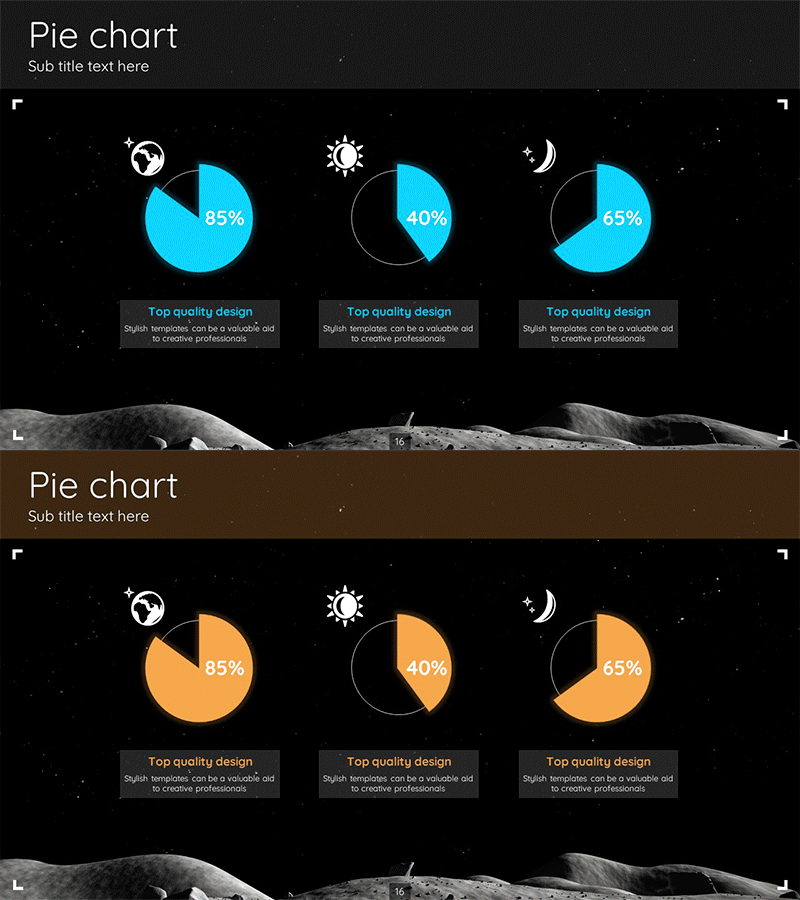
Space Exploration Pie Chart – A New Horizon for Data Analysis
#Product/Service #Graph #Development Status
-
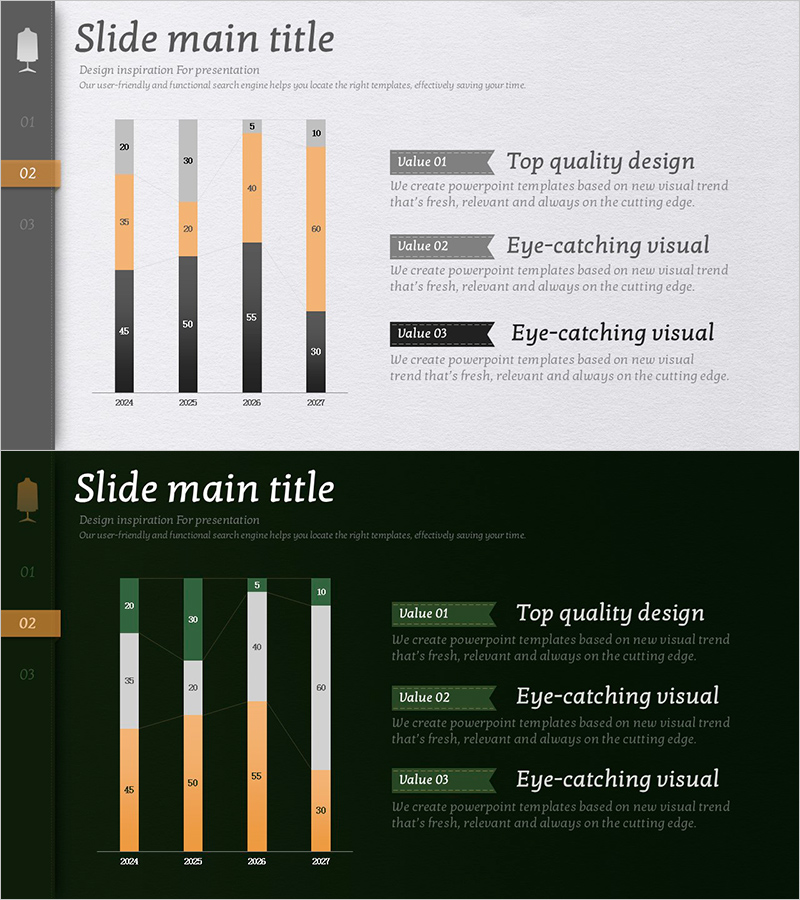
Trend of Market Share by Suit Product – Effective Graph for Market Analysis
#Market and Competitor Analysis #Graph #Market Analysis
