Financial Plans and Performance
Sensuous Cloud Presentation Template for Financial Performance Visualization – Business Insight
RJ0200039_19
- Last Update 12/21/2025
- File Size 0.2MB
- # of Slides 2
- File Format PPTX
- Slide Ratio 16:9
- Color
Keywords
About the Product
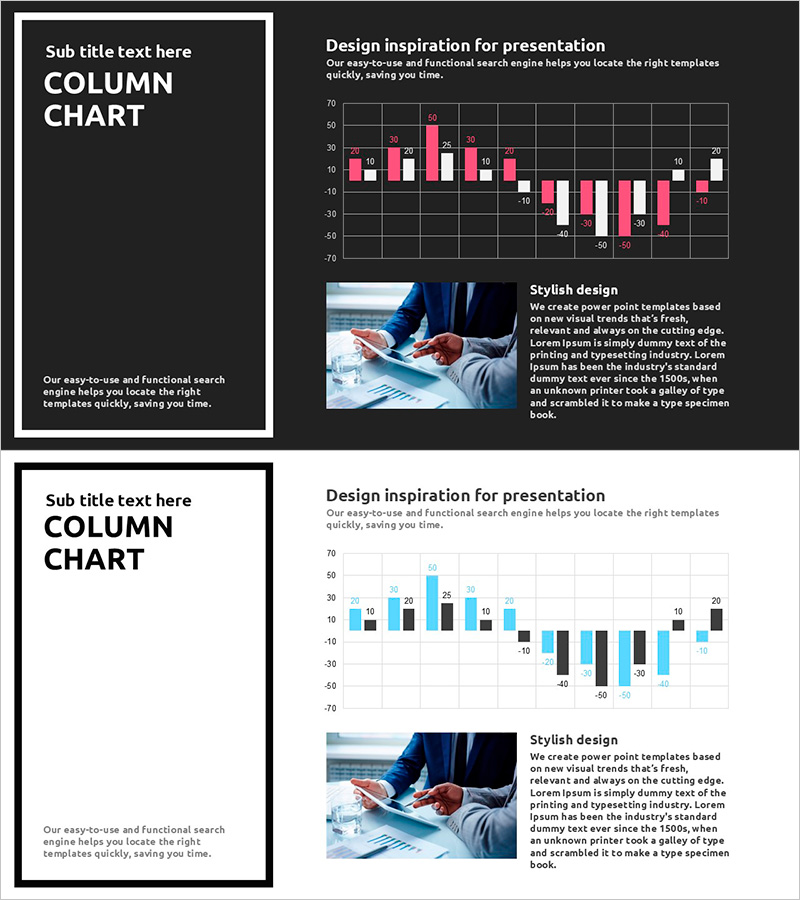
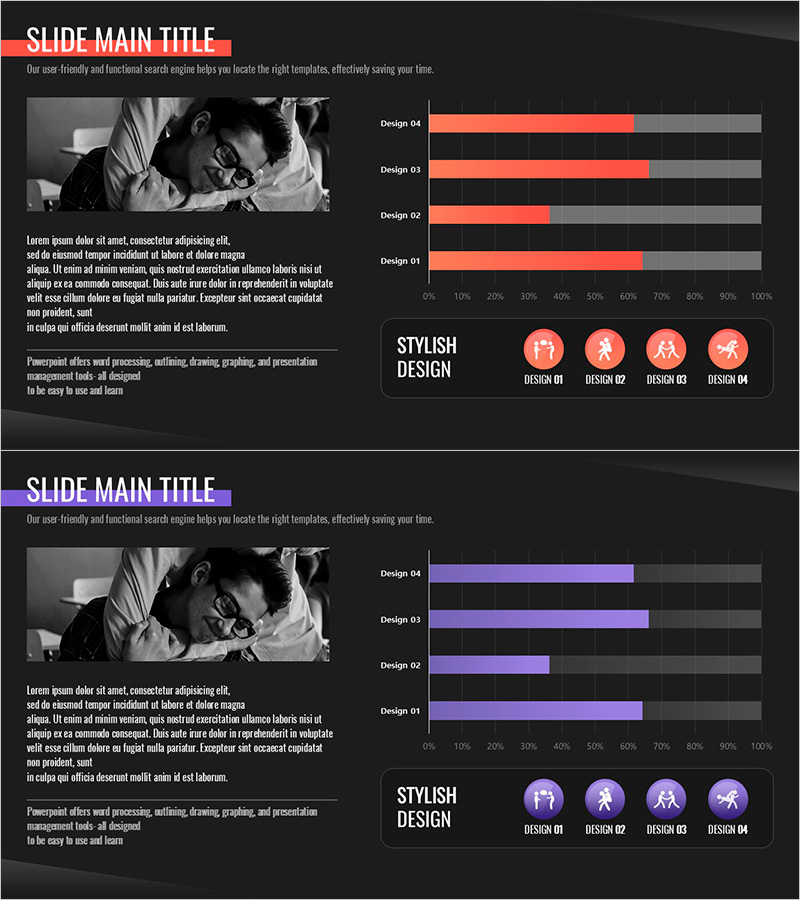
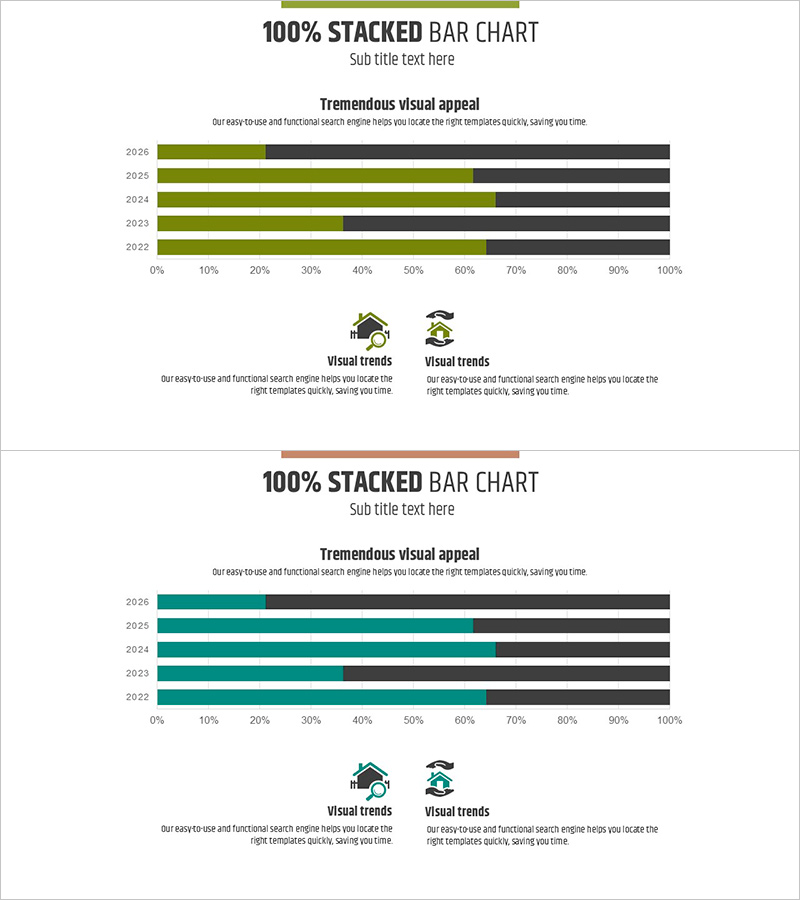
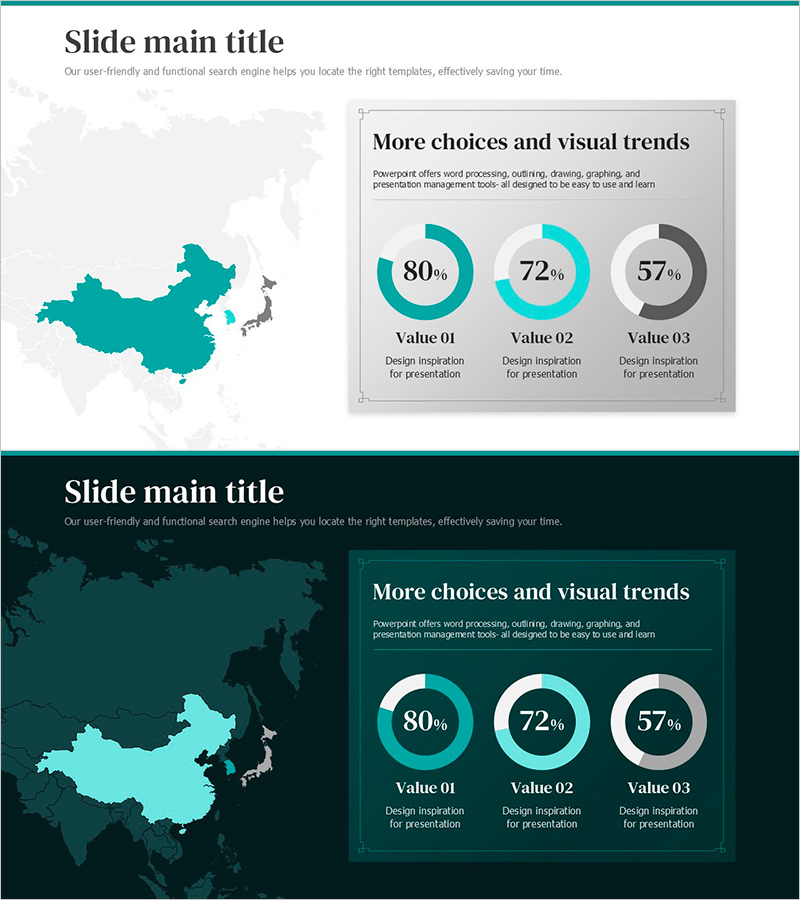
This slide utilizes vertical and horizontal bar charts to visually convey sensuous financial performance. The striking combination of red and blue colors is prominently featured, designed for clear analysis and comparison of key financial data. The theme of 'Business Insight' makes it ideal for investment pitches and profit-and-loss statement presentations. The template is user-friendly, allowing easy integration of various data inputs, making it suitable for beginners.
Related Products
-
Current Status of School Violence from Data – Utilizing Bar Graphs
#Market and Competitor Analysis #Graph #Market Analysis
-
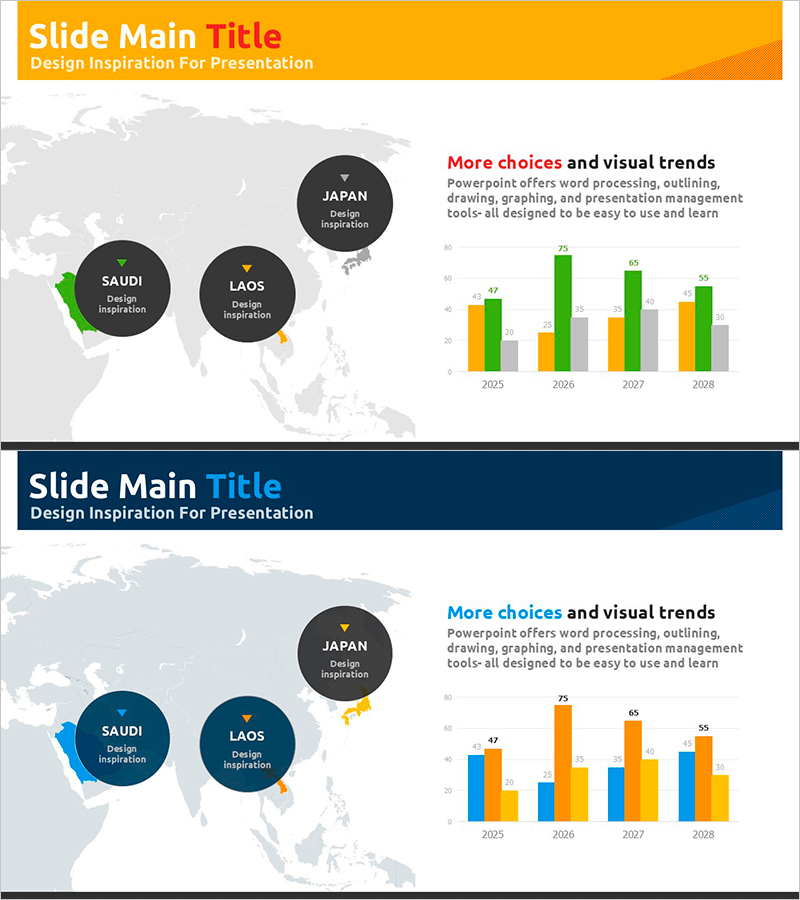
Chart of Change in Sales by Country – Market Analysis and Competitive Advantage
#Market and Competitor Analysis #Graph #Other
-
Quarterly Analysis Bar Chart for Real Estate Volume
#Market and Competitor Analysis #Graph #Industry Trends
-
Asian Target Market Analysis – Data-Driven Visualization
#Market and Competitor Analysis #Graph #Other
