Quarterly Analysis Bar Chart for Real Estate Volume
RJ0900012_15
- Last Update 08/19/2025
- File Size 0.1MB
- # of Slides 2
- File Format PPTX
- Slide Ratio 16:9
- Color
Keywords
- #Content-Based Slides
- #Design-Based Slides
- #Market and Competitor Analysis
- #Graph
- #Industry Trends
- #Horizontal Bar
- #Segmented Horizontal Bar
- #16:9
- #100% stacked bar chart PowerPoint
- #real estate transaction volume slide
- #quarterly analysis presentation
- #segmented graph template
- #market trend chart download
About the Product
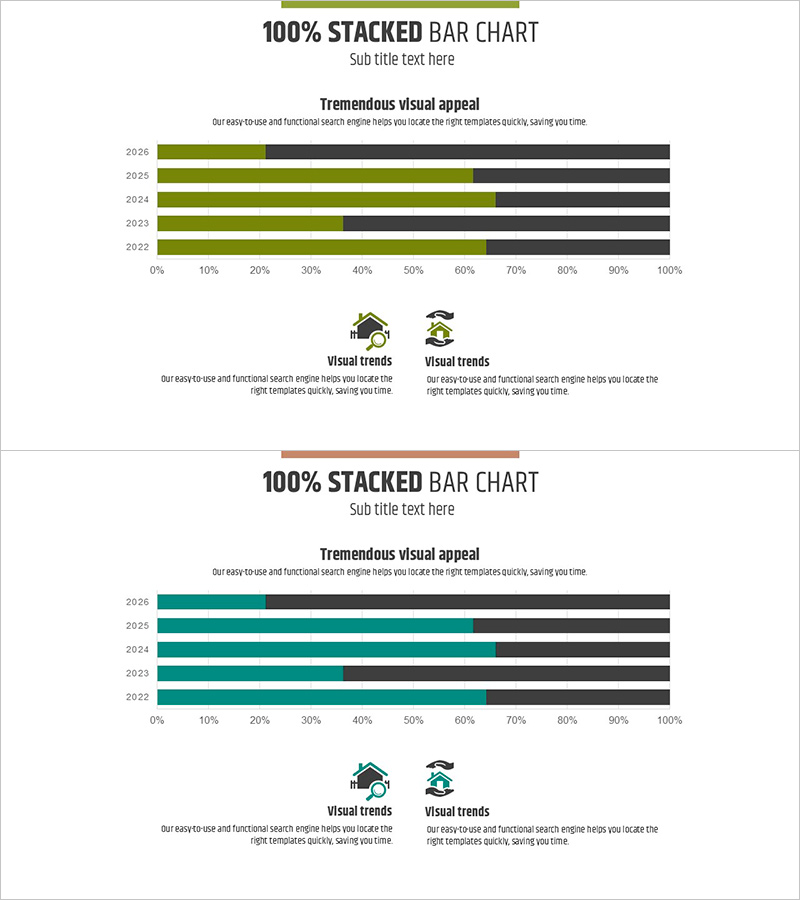
A 100% stacked horizontal bar chart PowerPoint slide designed for real estate transaction volume analysis. This presentation template visualizes five years of quarterly data (2022–2026) using a two-series composition with olive green and charcoal gray. Each year's proportional breakdown is instantly visible, making it ideal for real estate market trend analysis, transaction volume reporting, and quarterly performance presentations. The slide deck features a 16:9 widescreen format across 2 fully editable slides, allowing you to customize data, colors, and text to match your corporate branding.
Usage Points
-
Main Usage
Clearly communicate quarterly real estate transaction volume composition and market trend shifts using proportional visualization. The 100% stacked format enables direct comparison of each quarter's contribution to annual volume across five years, delivering data-driven insights to investors, tenants, policymakers, and market analysts with high credibility.
-
How to Use
Deploy this slide in real estate market analysis reports, quarterly earnings presentations, investor relations (IR) meetings, market trend seminars, and industry conferences. Simply replace the sample data and labels with your own figures, and adjust the color scheme to align with your organization's visual identity. The template is immediately presentation-ready.
-
Recommended For
Real estate developers, brokerage firms, financial analysts, market research professionals, policy makers, and MBA students preparing business presentations. Particularly valuable for financial reports, marketing strategy pitches, and academic seminars requiring quarterly and year-over-year comparative analysis.
-
Slide Structure
Two-slide deck. Slide 1 features five 100% stacked horizontal bars (2022–2026) in olive green and charcoal gray, horizontal axis 0–100%, legend with two series, and descriptive text area. Slide 2 provides an alternative design variant using teal and charcoal gray. Both slides include visual trend icons and supporting text blocks at the bottom for additional context.
Related Products
-

Eco-friendly Business Market Share Segmentation Horizontal Bar Chart
#Market and Competitor Analysis #Graph #Industry Trends
-

Navy-Orange 100% Stacked Chart
#Market and Competitor Analysis #Graph #Industry Trends
-

Horizontal Bar Chart for Changes in the Climbing Population – Market Trend Analysis
#Market and Competitor Analysis #Graph #Industry Trends
-

Analyzing Flower Horizontal Segmentation Charts – Understanding Market Trends
#Market and Competitor Analysis #Graph #Industry Trends
