Market and Competitor Analysis
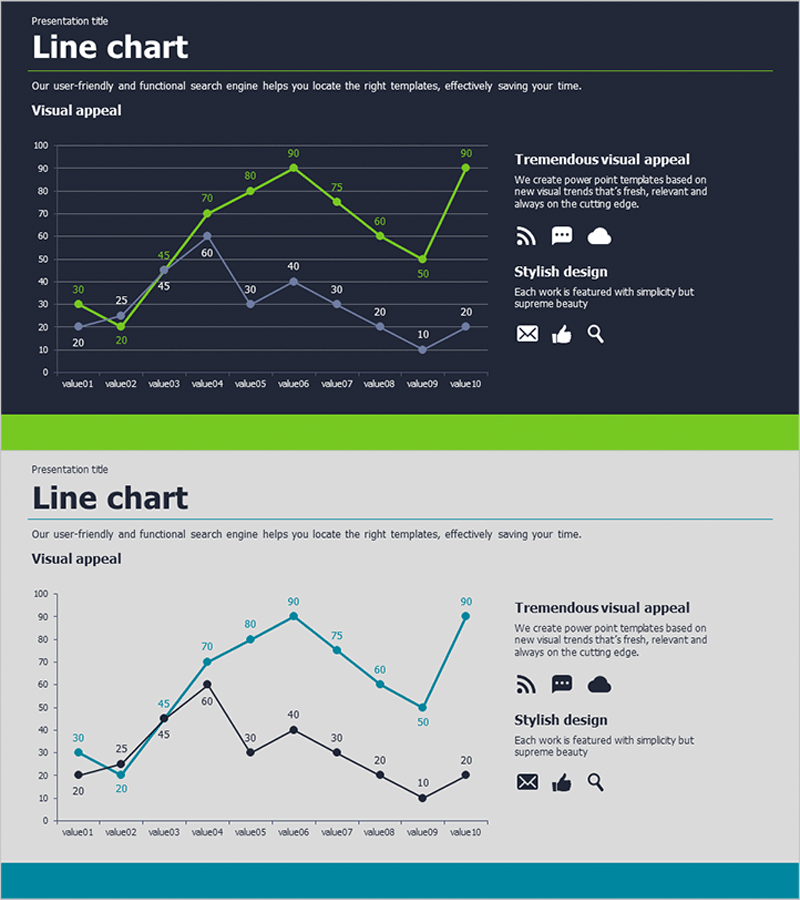
Line Chart for Market and Competitive Analysis – Future Outlook and Investment Returns
RJ0200001_12
- Last Update 12/21/2025
- File Size 0.1MB
- # of Slides 2
- File Format PPTX
- Slide Ratio 16:9
- Color
Keywords
About the Product
This slide leverages a line chart to visualize market and competitive analysis results. The intuitive data structure makes it easy to present financial planning and future outlook. The use of green and teal colors emphasizes trust and stability, while the design highlights a clean and modern aesthetic. This template is ideal for conveying critical data for effective decision-making to investors and executives. The text and graph areas are easy to replace, with an editing difficulty rated as 'easy', allowing for immediate integration into various business presentations.
Related Products
-
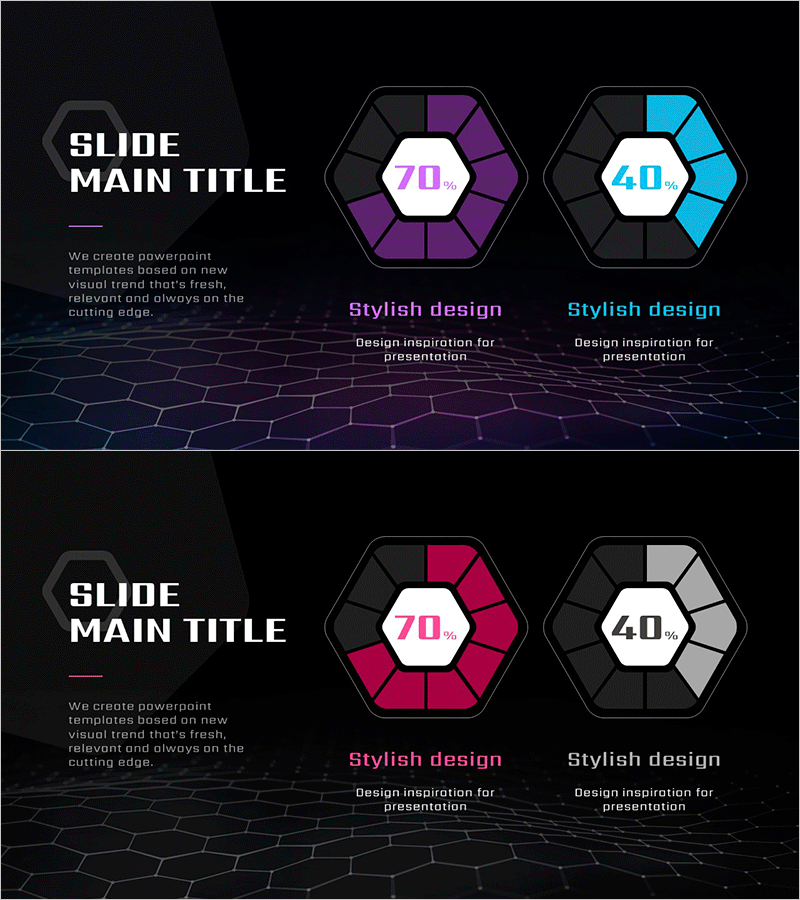
Innovative AI Themed Hexagonal Graph – Visualizing Market Share at Angles
#Product/Service #Market and Competitor Analysis #Graph
-
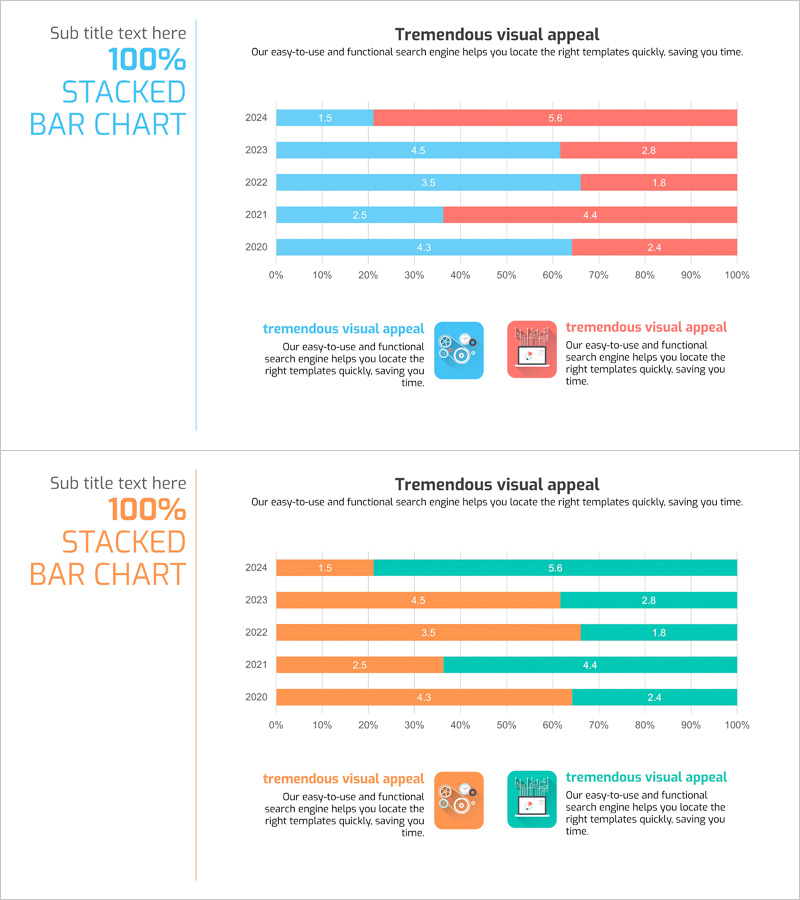
Big Data Field Analysis Graph – Horizontal Bar Chart Showing Competitive Advantage
#Market and Competitor Analysis #Graph #Competitor Analysis
-

Visualizing Health Trends with Smart Watch – Innovation and Management
#Market and Competitor Analysis #Graph #Competitor Analysis
-
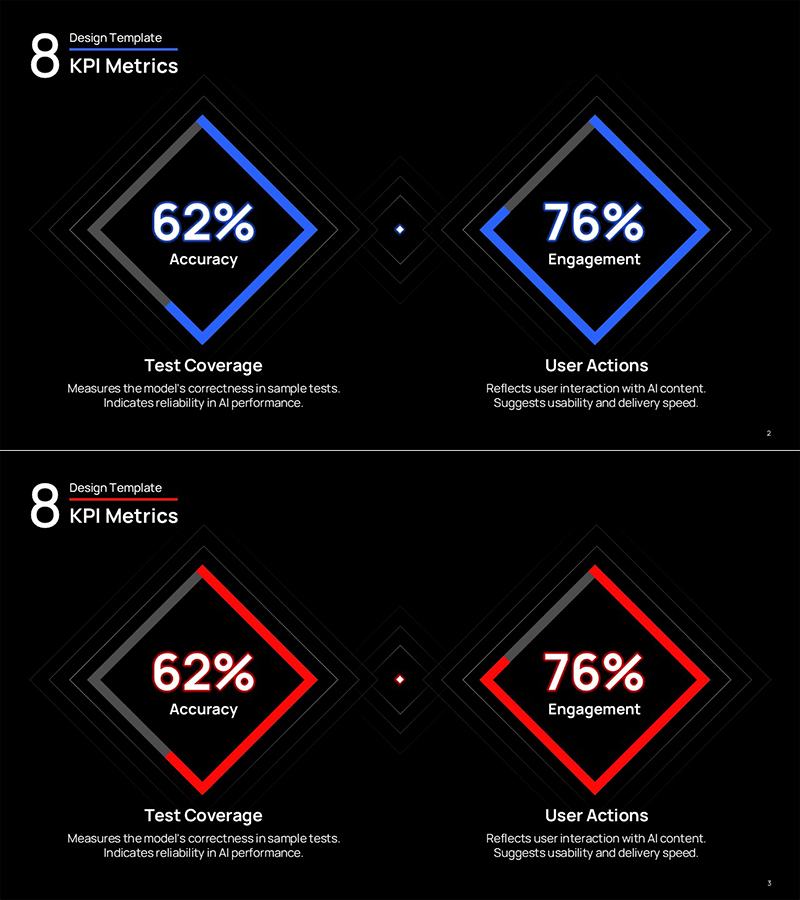
AI Neon Rhombus Visual Template – KPI Metrics Visualization
#Product/Service #Graph #Features
