Market and Competitor Analysis
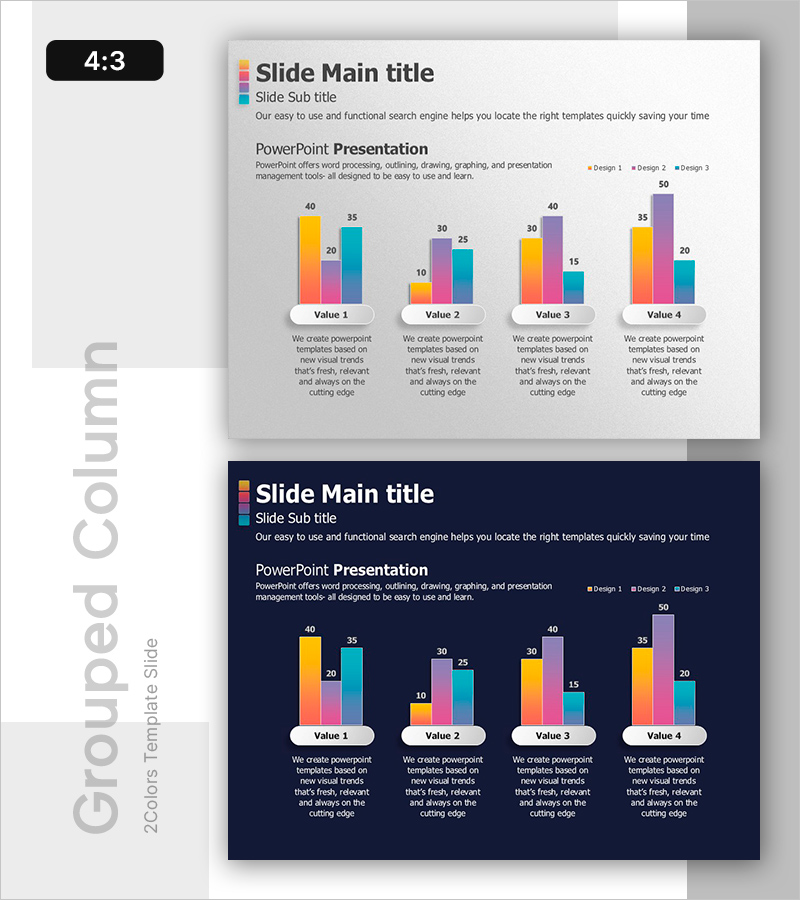
Visual Comparison by Product Group Slide Template – Market Trends and Performance
RB0800050_8
- Last Update 12/21/2025
- File Size 1.4MB
- # of Slides 2
- File Format PPTX
- Slide Ratio 4:3
- Color
Keywords
About the Product
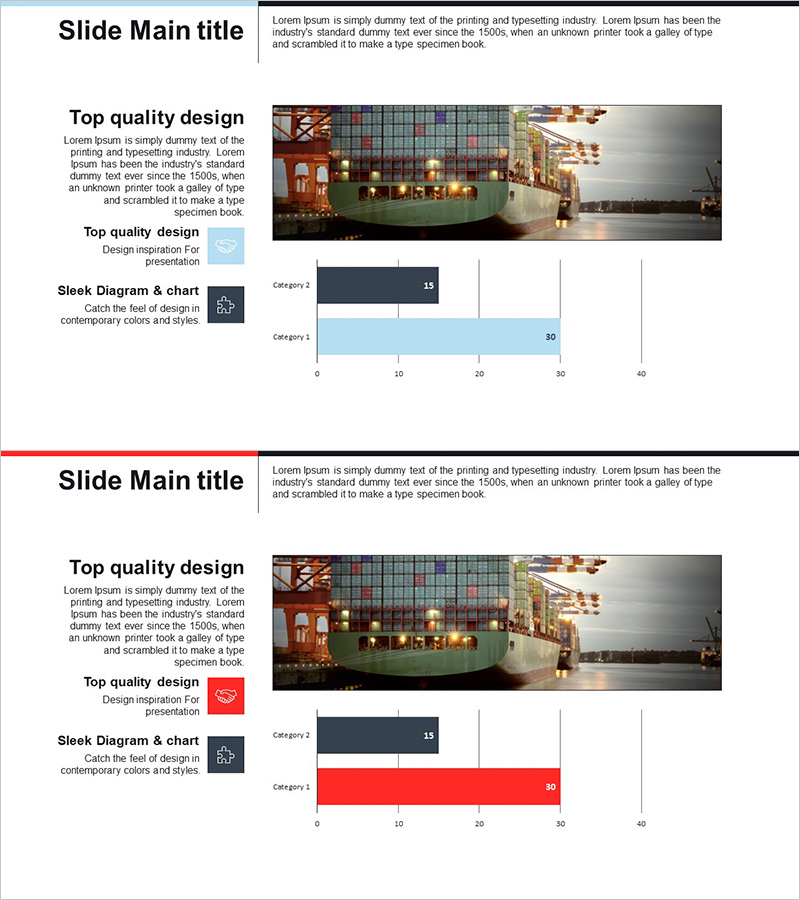
This slide effectively presents visual analysis through product group comparisons using horizontal and vertical bar charts. The harmonious blend of orange, purple, and blue enhances information delivery and is suitable for capturing the audience's attention. It is particularly useful in business situations such as budget planning and performance analysis meetings, conveying insights on sales and revenue through market and competitor analysis.
Related Products
-
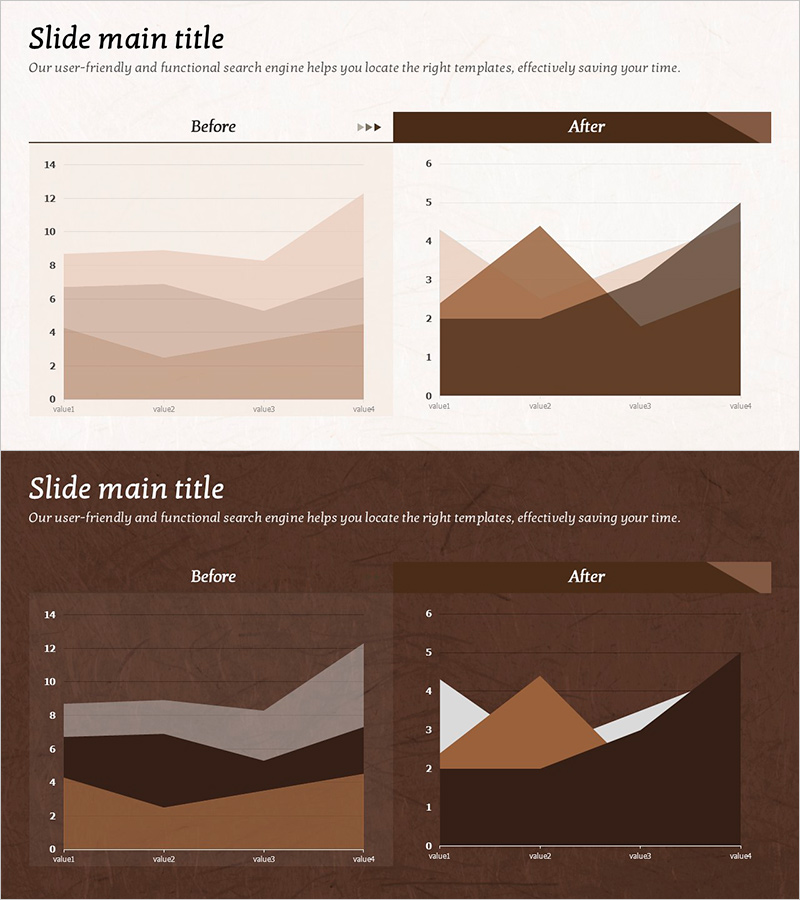
Brown Region Form Before and After Graphs – Data Comparison Visualization
#Graph
-
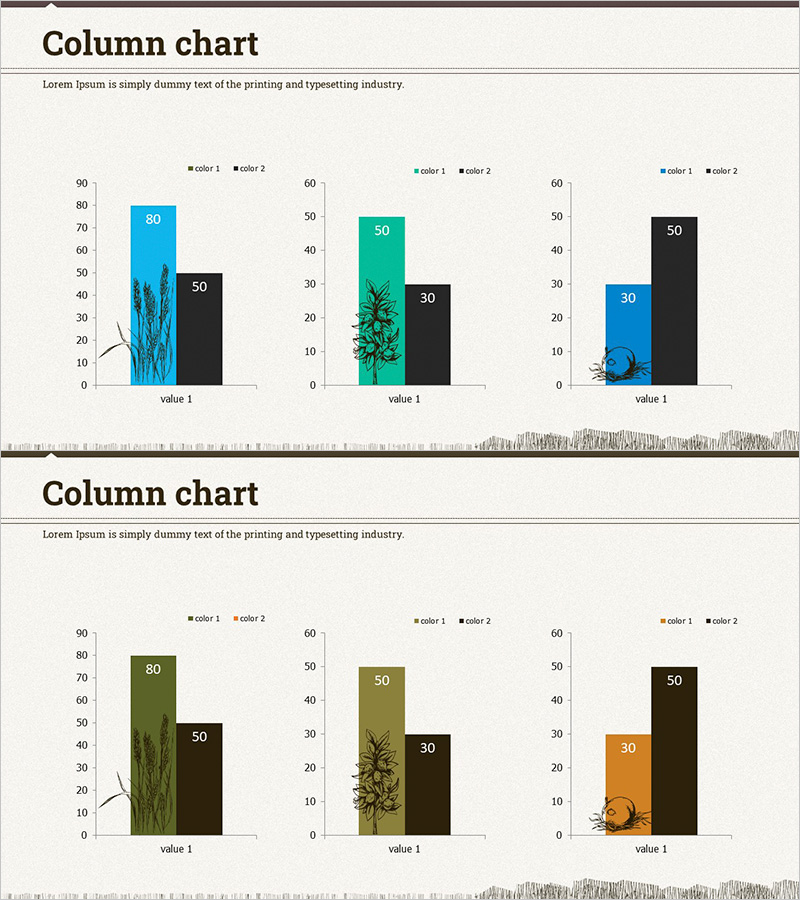
Competitiveness Analysis in Agriculture - Vertical Bar Chart
#Market and Competitor Analysis #Graph #Competitor Analysis
-
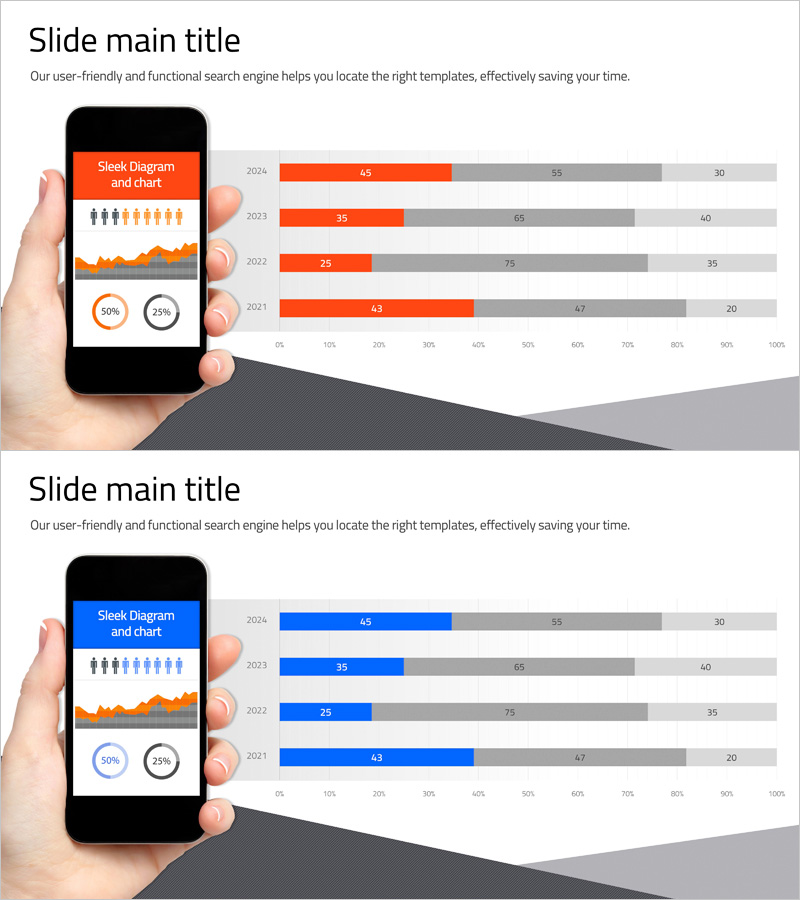
User Analysis Status by Year – Growth and Change
#Product/Service #Market and Competitor Analysis #Graph
-
Trade Business Analysis Bar Chart - Insights on Competitors and Markets
#Market and Competitor Analysis #Graph #Competitor Analysis
