Competitiveness Analysis in Agriculture - Vertical Bar Chart
RJ0600073_5
- Last Update 07/09/2025
- File Size 4.2MB
- # of Slides 2
- File Format PPTX
- Slide Ratio 16:9
- Color
Keywords
- #Content-Based Slides
- #Design-Based Slides
- #Market and Competitor Analysis
- #Graph
- #Competitor Analysis
- #Competitive Advantage
- #Column
- #Column Chart
- #16:9
- #vertical bar chart PowerPoint
- #column chart slide template
- #2-series data comparison
- #competitive analysis chart
- #data visualization PowerPoint slide
About the Product
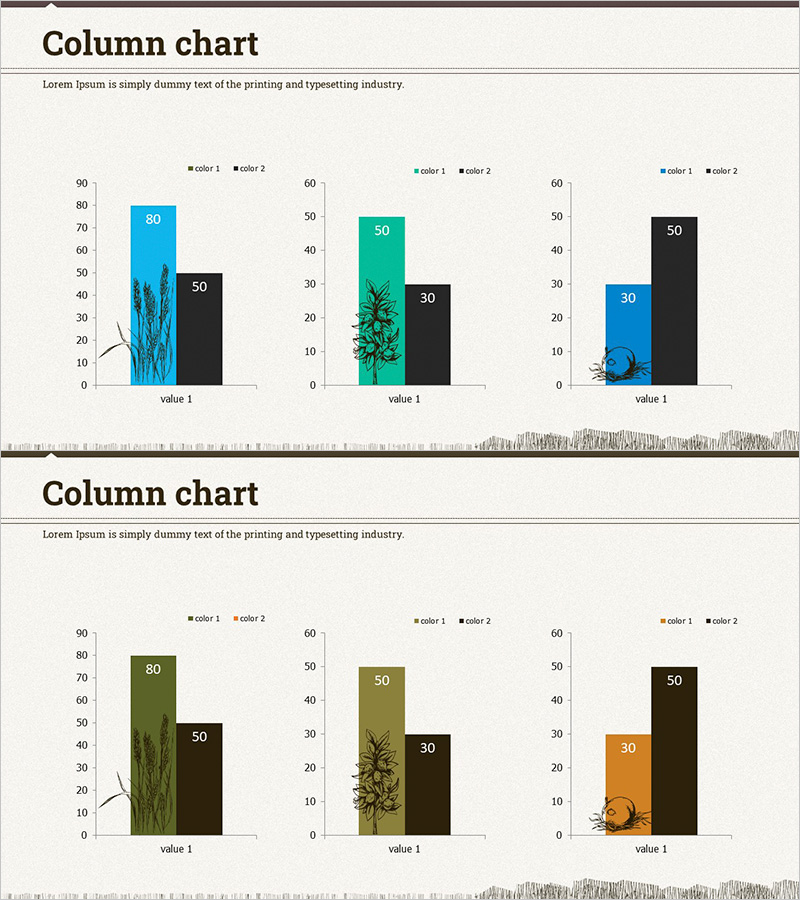
A vertical bar chart PowerPoint slide designed for competitiveness analysis and market comparison presentations. Two data series are displayed side-by-side in column format, enabling clear visual comparison of numerical values. The slide includes color-coded legends and data labels for immediate readability. Fully editable in PowerPoint, this presentation template is ideal for business reports, competitive analysis, performance reviews, and industry benchmarking across agriculture, manufacturing, and service sectors.
Usage Points
-
Main Usage
Displays two data series as vertical columns side-by-side to facilitate direct numerical comparison and highlight differences. Color-coded bars and data labels enable audiences to grasp exact values and trends instantly without additional explanation.
-
How to Use
Open the slide in PowerPoint and adjust bar heights and colors to match your dataset. Update legend text and axis labels to reflect your presentation topic, then display in slideshow mode to your audience.
-
Recommended For
Market analysis, competitor benchmarking, sales performance comparison, year-over-year results, departmental performance evaluation, and industry-specific competitiveness analysis in agriculture, food, manufacturing, and related sectors.
-
Slide Structure
2-slide deck. Each slide contains a vertical bar chart with 2 data series distinguished by color pairs (blue-black, teal-black, blue-black). Y-axis ranges 0–90, X-axis labeled 'value 1', with numerical values displayed above each bar for clarity.
Related Products
-

Data Analysis with Zombie Hand Graph Visualization
#Market and Competitor Analysis #Graph #Competitor Analysis
-

Comparative Analysis Graph – Market and Competitor Analysis
#Market and Competitor Analysis #Graph #Competitor Analysis
-

Comparative Analysis 3D Cylinder Bar Graph – Market and Competitor Analysis
#Market and Competitor Analysis #Graph #Competitor Analysis
-

Gradient PPT Wide Template Vertical Bar Comparison Graph
#Market and Competitor Analysis #Graph #Competitor Analysis
