
Graph
Stacked Revenue Trends from Marketing Efforts – Effective Data Visualization
RB0800030_15
- Last Update 12/21/2025
- File Size 4MB
- # of Slides 2
- File Format PPTX
- Slide Ratio 4:3
- Color
Keywords
About the Product
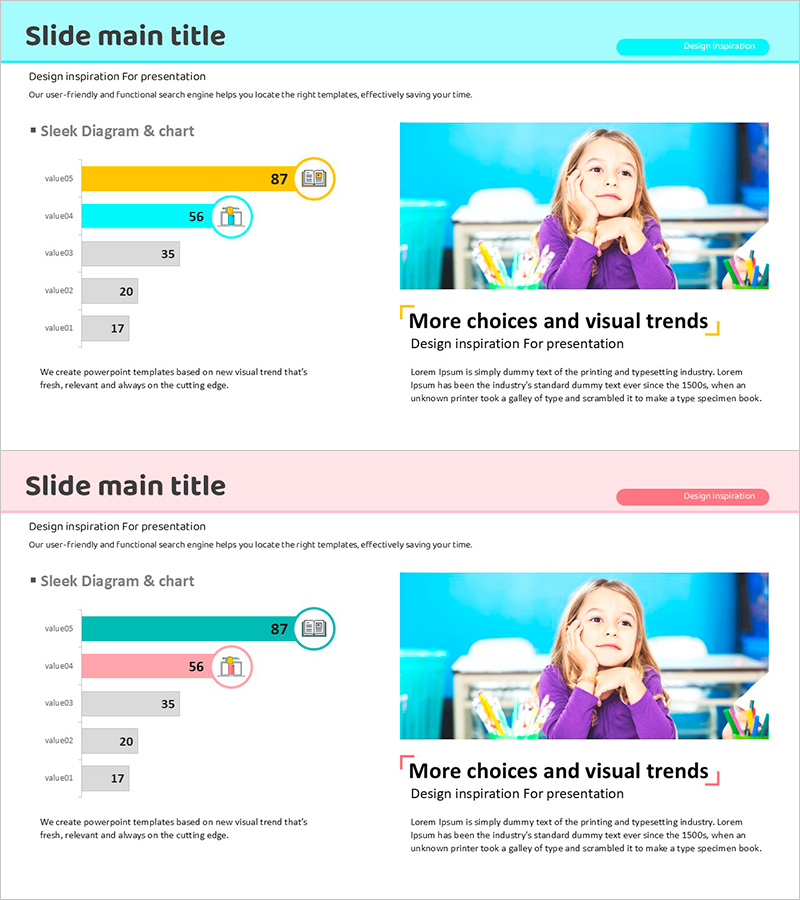
This slide features a stacked graph template that visually represents cumulative revenue trends derived from marketing efforts. Using brown, teal, and violet hues, it clearly conveys the variations across revenue items. This template is ideal for annual performance reports or marketing strategy presentations. The top of the slide offers a wide title area, while the bottom graph illustrates revenue flow from 2025 to 2028. Designed for instant application in business marketing-related materials, this slide has a moderate editing difficulty, with both graphs and texts easily replaceable.
Related Products
-
Scientific Research Results Graph – A Tool for Market Analysis and Competitive Advantage
#Market and Competitor Analysis #Graph #Market Analysis
-
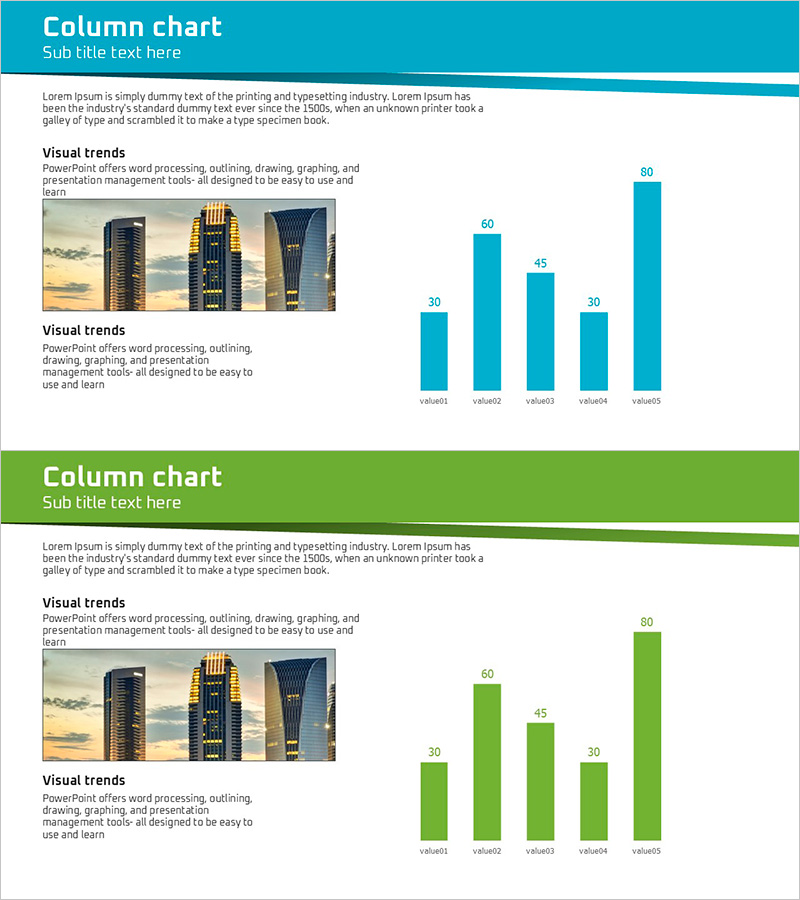
Business Forest Wide Template Column Chart
#Company Introduction #Graph #Company Overview
-
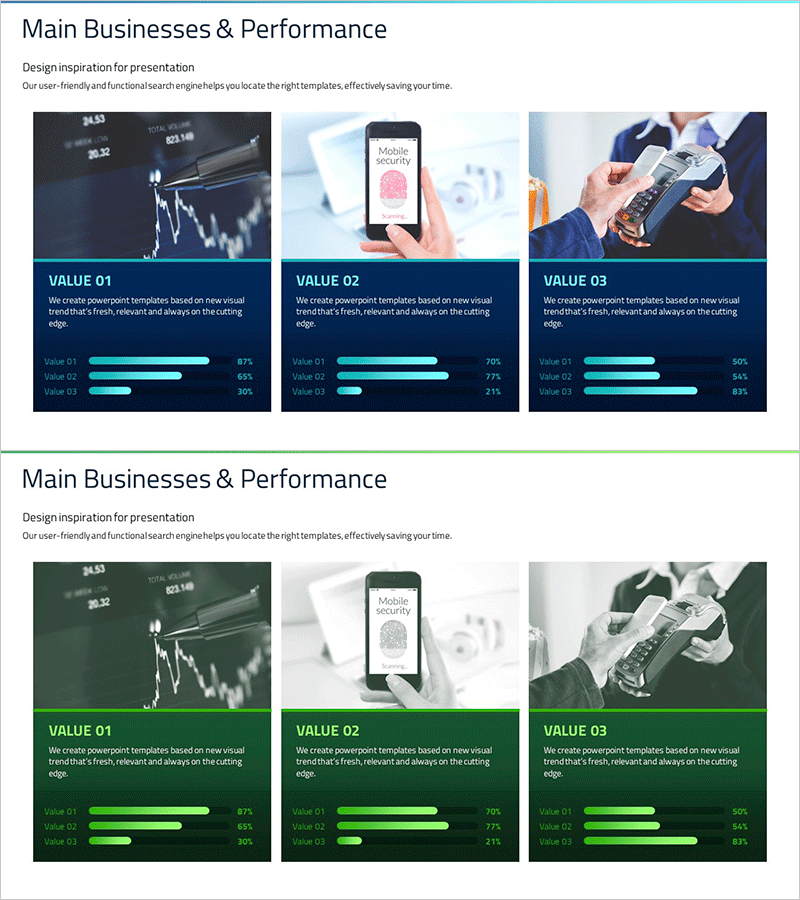
Main Business Analysis Graph – Performance Insights
#Company Introduction #Business Introduction #Diagram
-
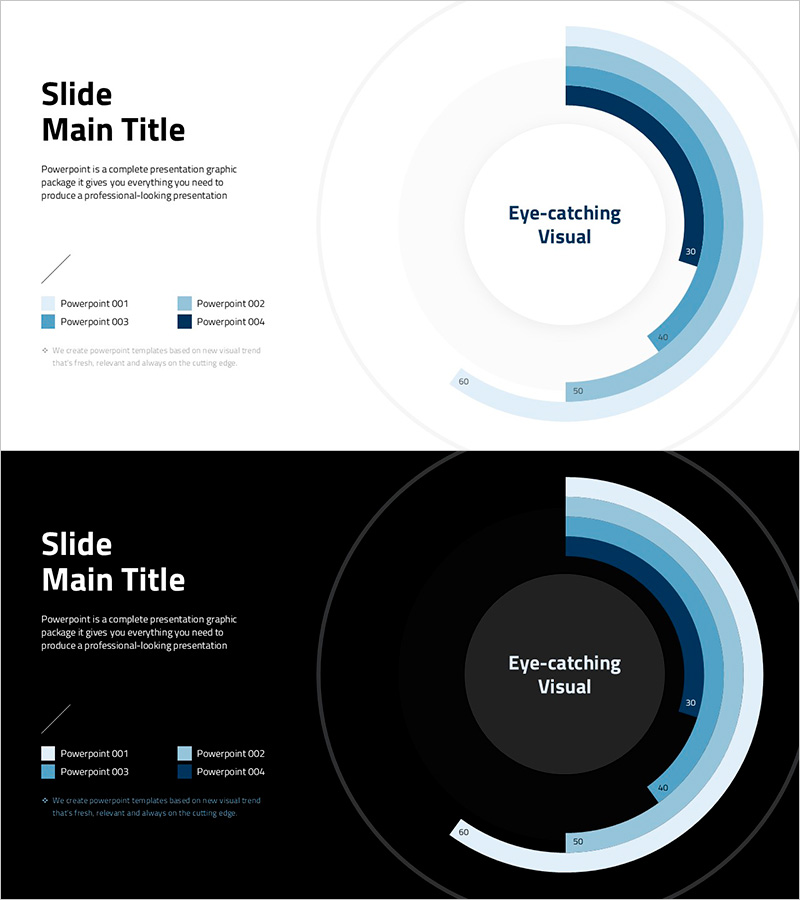
Visualizing Simple Design Trend with Donut Chart PPT
#Company Introduction #Product/Service #Graph
