Business Introduction
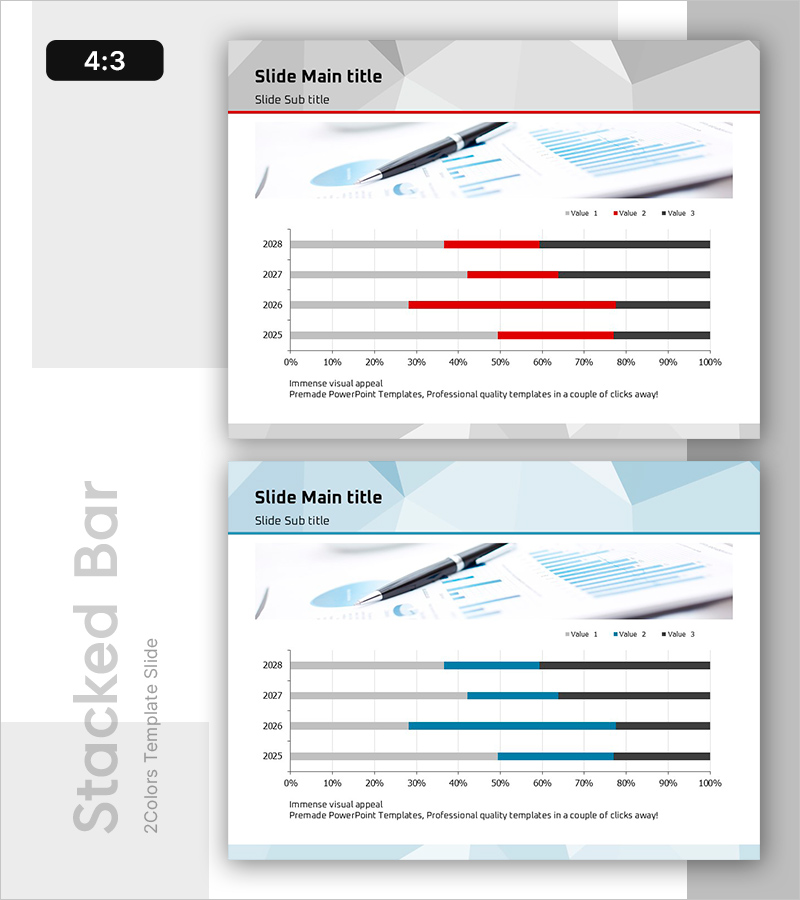
Yearly Breakdown of Sales Trends – Visualizing Market Dynamics
RB0800027_11
- Last Update 12/21/2025
- File Size 2.4MB
- # of Slides 2
- File Format PPTX
- Slide Ratio 4:3
- Color
Keywords
About the Product
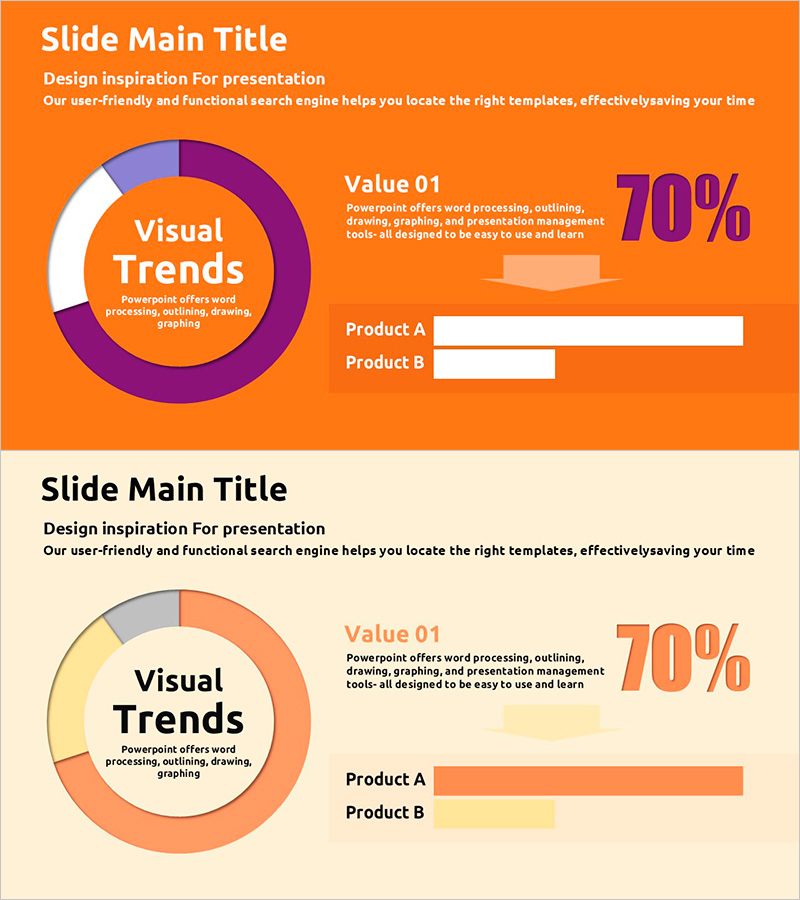
This PowerPoint slide is designed to provide a clear overview of yearly sales trends through a horizontal bar chart. The segmented bar format allows for straightforward data comparison, enhanced by a striking red and blue color scheme that increases visual engagement. This slide is ideal for conducting market trend analyses, presenting results, or compiling annual reports. Business professionals will find it invaluable for competitor analysis and formulating sales strategies. Editing is straightforward, allowing users to easily swap text and data, with a difficulty rated as 'medium'.
Related Products
-
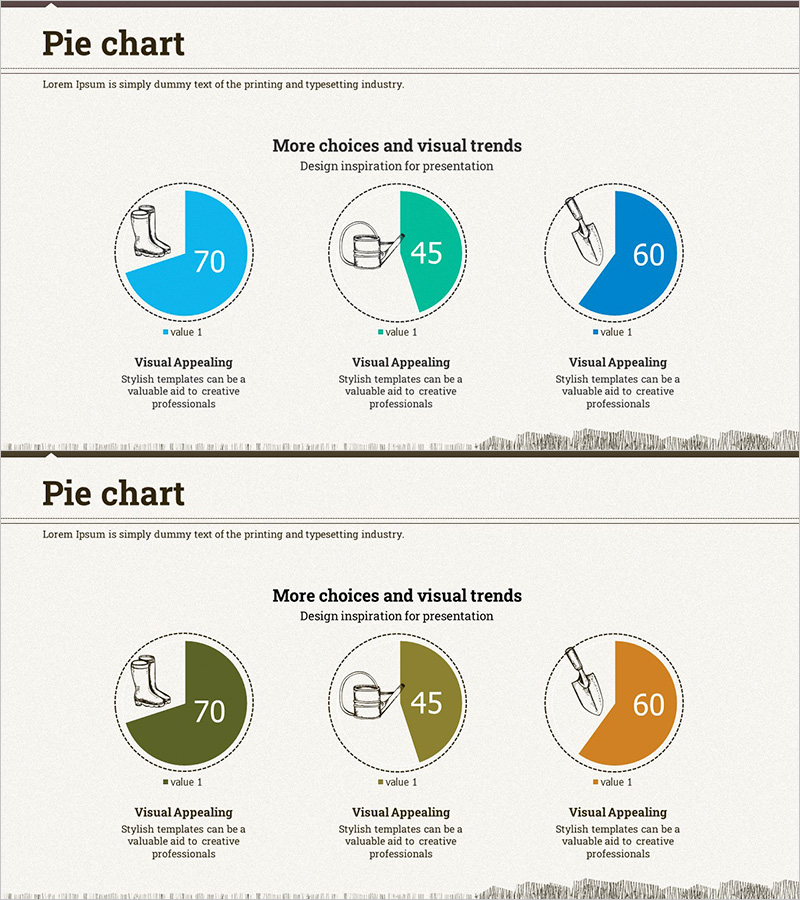
Agricultural Equipment Investment Plan Pie Chart
#Market and Competitor Analysis #Graph #Market Status
-
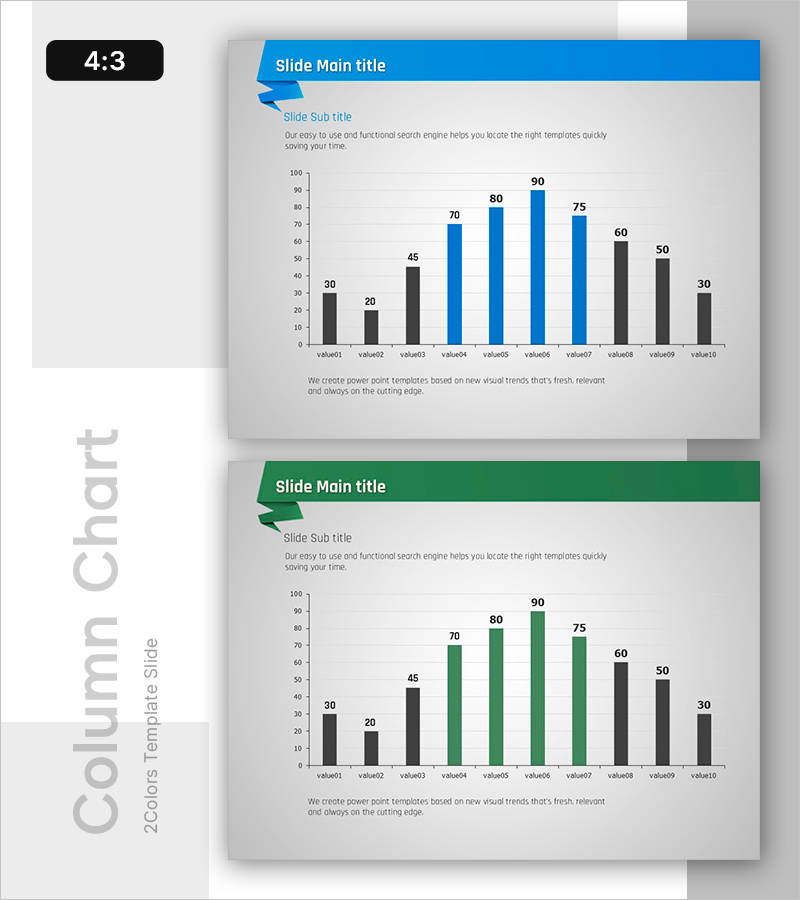
Column Chart for PowerPoint – Visualization of Market Analysis and Performance
#Market and Competitor Analysis #Financial Plans and Performance #Graph
-
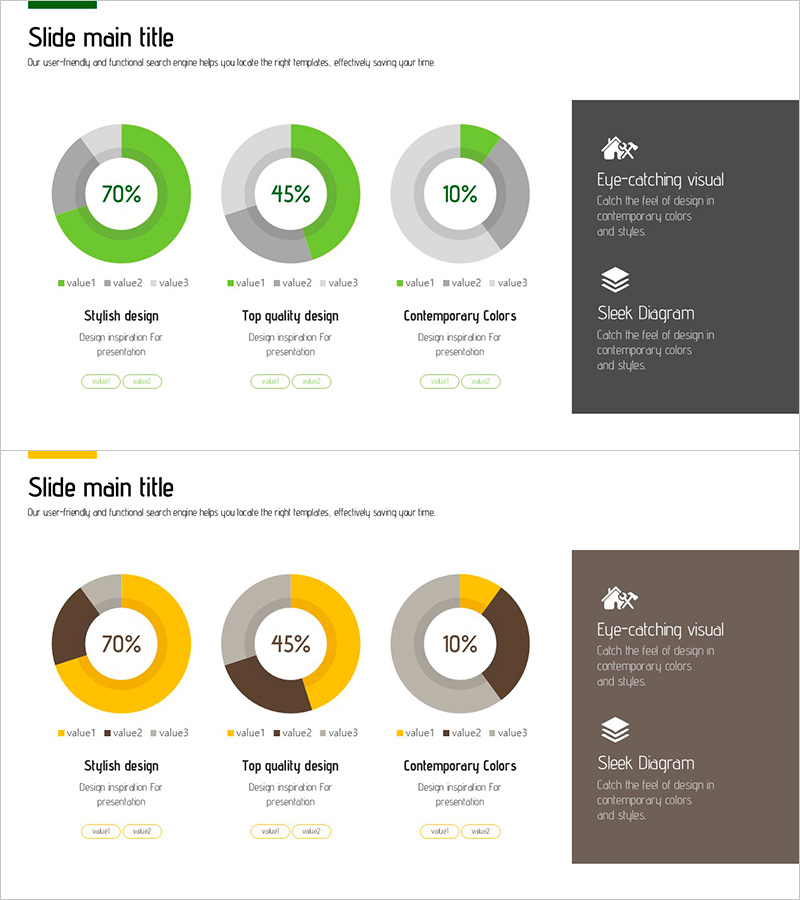
Donut Chart Depicting Market Share – Status of Home Repair Support Projects
#Market and Competitor Analysis #Graph #Market Status
-
Donut Chart for Market and Competitor Analysis – Color Theme Presentation
#Market and Competitor Analysis #Graph #Competitor Analysis
