Donut Chart for Market and Competitor Analysis – Color Theme Presentation
RJ0200043_21
- Last Update 04/10/2025
- File Size 0.3MB
- # of Slides 2
- File Format PPTX
- Slide Ratio 16:9
- Color
Keywords
- #Content-Based Slides
- #Design-Based Slides
- #Market and Competitor Analysis
- #Graph
- #Competitor Analysis
- #Competitive Advantage
- #Circles
- #Doughnut Chart
- #16:9
- #donut chart PowerPoint
- #pie chart slide template
- #market analysis presentation
- #competitor comparison chart
- #ratio data visualization PowerPoint
About the Product
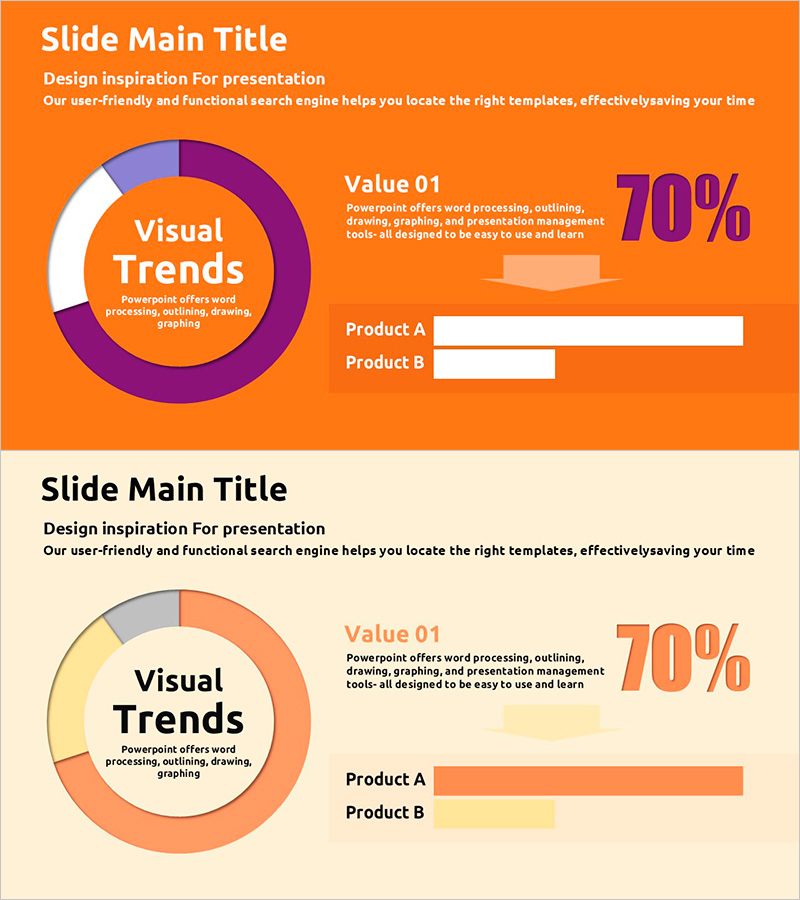
A PowerPoint slide template optimized for market analysis and competitor comparison using a donut chart design. The 4-segment pie chart in orange, purple, and beige colors intuitively represents market share, competitive advantage, customer satisfaction, and other ratio data. The 2-slide set features a donut chart with 70% emphasis metric on the first slide and a horizontal bar comparison chart on the second, effectively communicating quantitative analysis. This fully editable PPT template is ready for immediate use in presentations, business plans, and reports.
Usage Points
-
Main Usage
Visually represent ratio data for four categories such as market share, competitor comparison, customer satisfaction, and product composition using a donut chart. The center text area emphasizes key messages, while the 70% metric highlights primary indicators.
-
How to Use
Input actual data into the donut chart on the first slide to display market analysis results. Add Product A and B performance comparison using the horizontal bar chart on the second slide for multi-dimensional analysis. During presentation, highlight each segment color and corresponding metrics.
-
Recommended For
Marketing professionals, business planning teams, executives preparing reports, consultants, and sales presenters creating market overview, competitive analysis, and customer segmentation materials.
-
Slide Structure
2-slide set. Slide 1: 4-segment donut chart (orange, purple, beige, white) with center text area + top-right 70% emphasis metric + bottom descriptive text. Slide 2: Horizontal bar charts for Product A and B in matching colors + right-side Value 01 text area. 16:9 aspect ratio, PPTX format.
Related Products
-

Business Competitive Advantage Analysis Graph – Differentiation in the Market
#Market and Competitor Analysis #Diagram #Graph
-

Banking Services Sector Analysis Graph – Market and Competitor Analysis
#Market and Competitor Analysis #Graph #Competitor Analysis
-

Dental Caries Treatment Analysis Donut Circle Graph – A Clear Competitive Edge
#Market and Competitor Analysis #Diagram #Graph
-

Competitor Progress Comparison Analysis Graph – Essential Tool for Market Analysis
#Market and Competitor Analysis #Graph #Competitor Analysis
