Graph
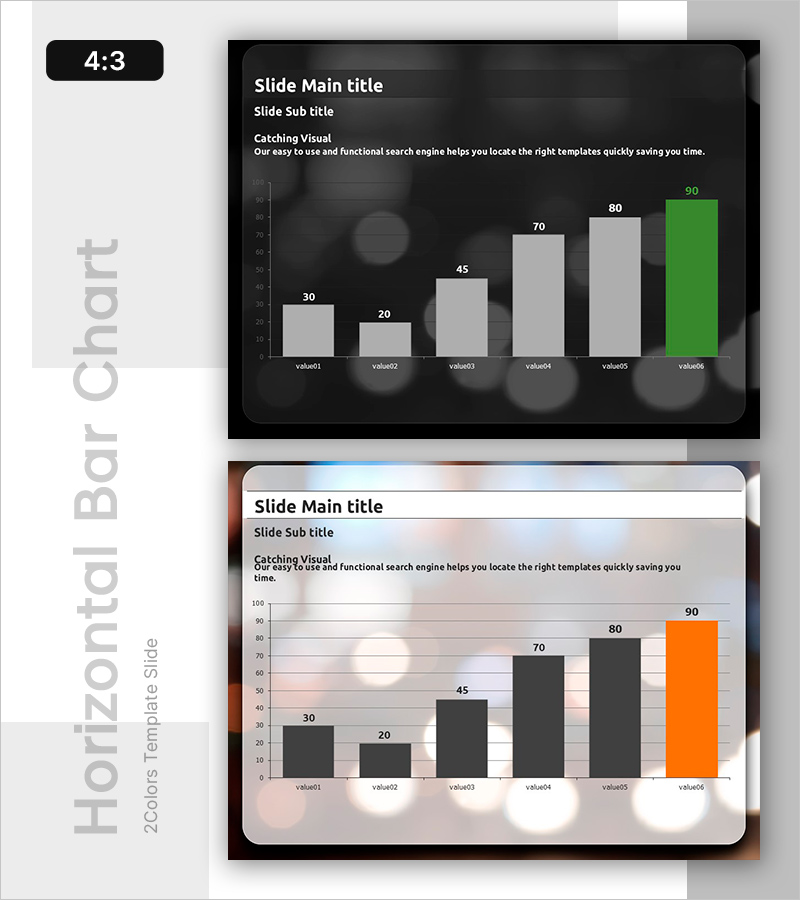
Graph Slide Visualizing Sales Trends by Product
RB0800024_10
- Last Update 12/21/2025
- File Size 1.5MB
- # of Slides 2
- File Format PPTX
- Slide Ratio 4:3
- Color
About the Product
This slide features a graph that visually compares sales trends by product effectively. Utilizing orange and green colors to highlight key data points, it suits various business presentations with its clear layout and sophisticated design. The slide can easily replace data values depending on the presentation context, and its editing difficulty is rated as 'easy'. It's mostly used for sales performance analysis, product reviews, and marketing strategy presentations.
Related Products
-
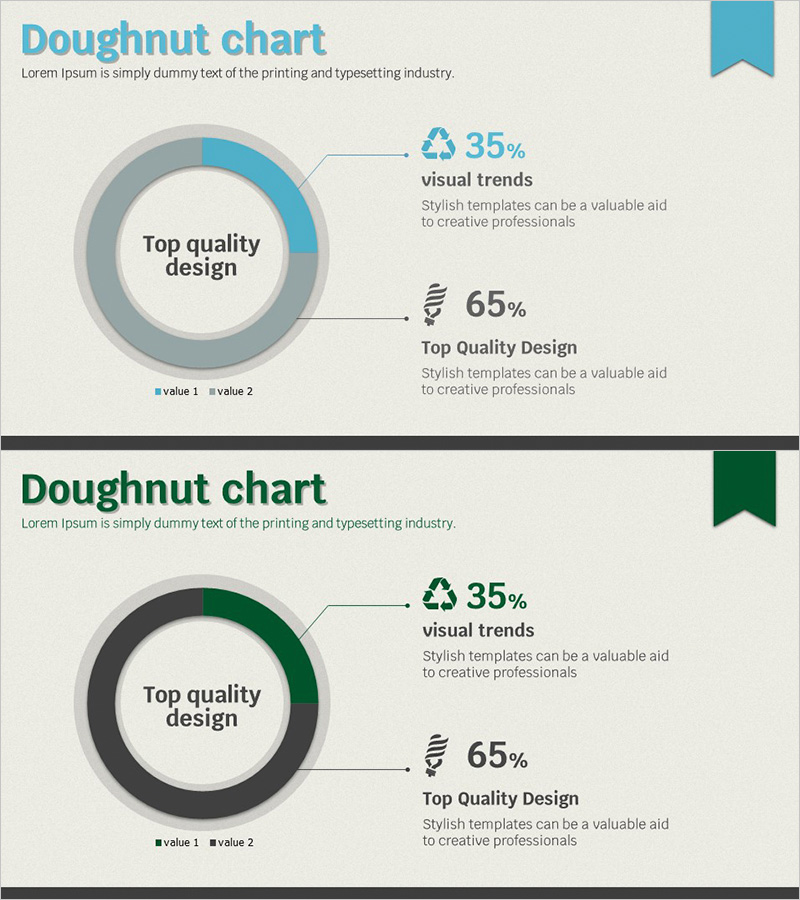
Separate Recycling Implementation Rate Survey Donut Chart – Visualized in Blue and Green
#Market and Competitor Analysis #Graph #Customer Analysis
-

Scientific Research Results Graph – A Tool for Market Analysis and Competitive Advantage
#Market and Competitor Analysis #Graph #Market Analysis
-
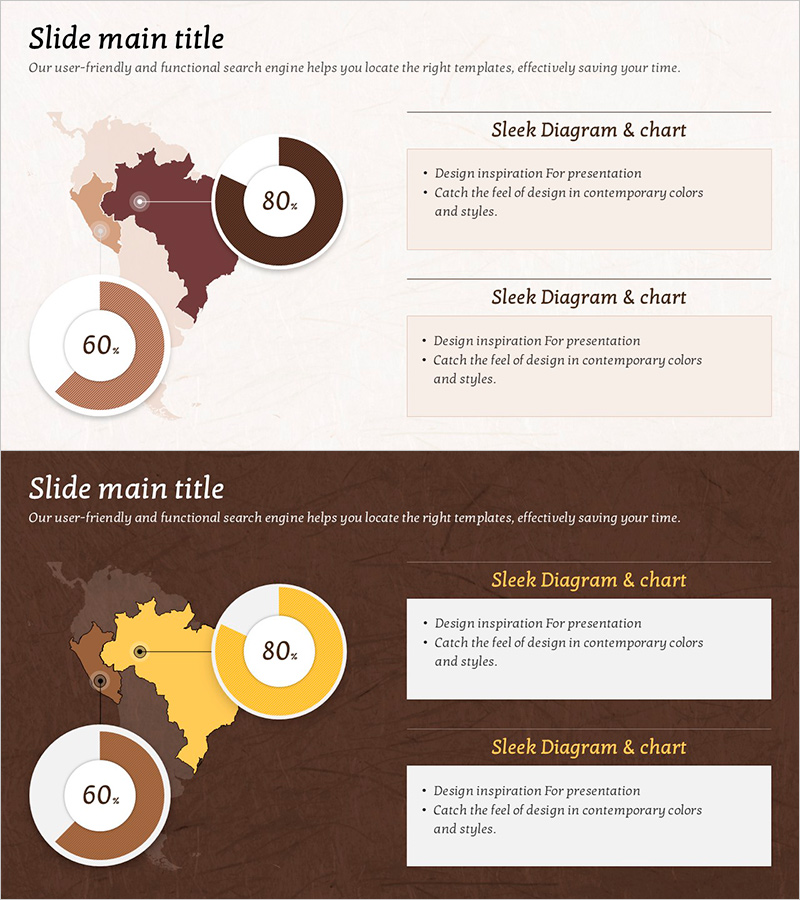
Brown Yellow Regional Analysis – Market Share Visualization
#Market and Competitor Analysis #Graph #Other
-
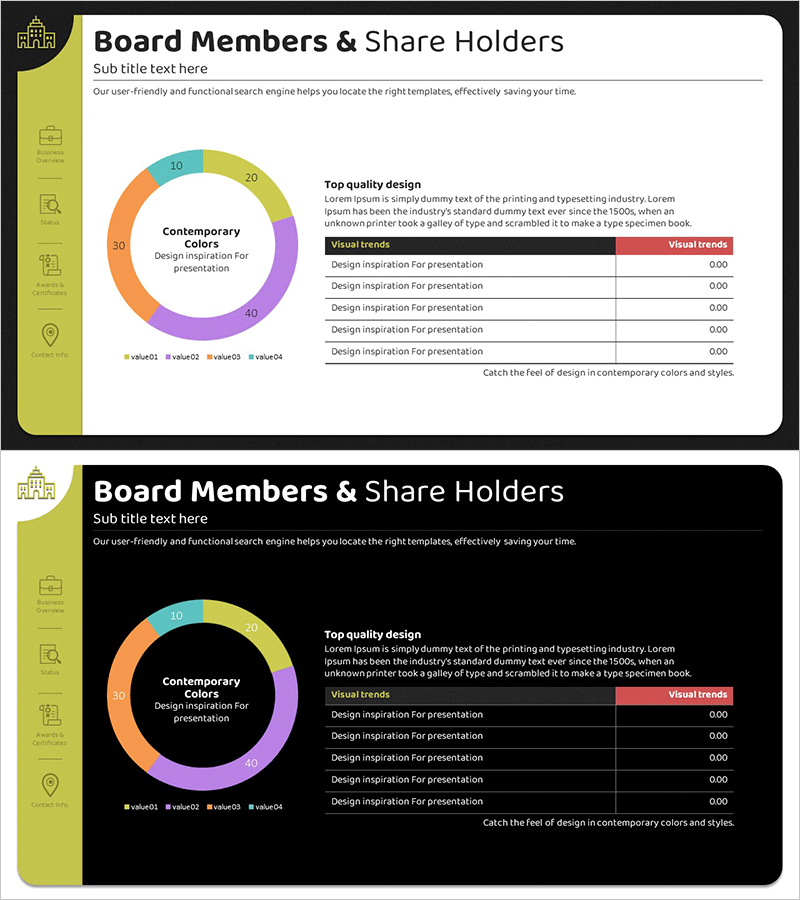
Shareholder Status Survey Donut Graph – Optimized for Market Analysis
#Company Introduction #Market and Competitor Analysis #Diagram
