
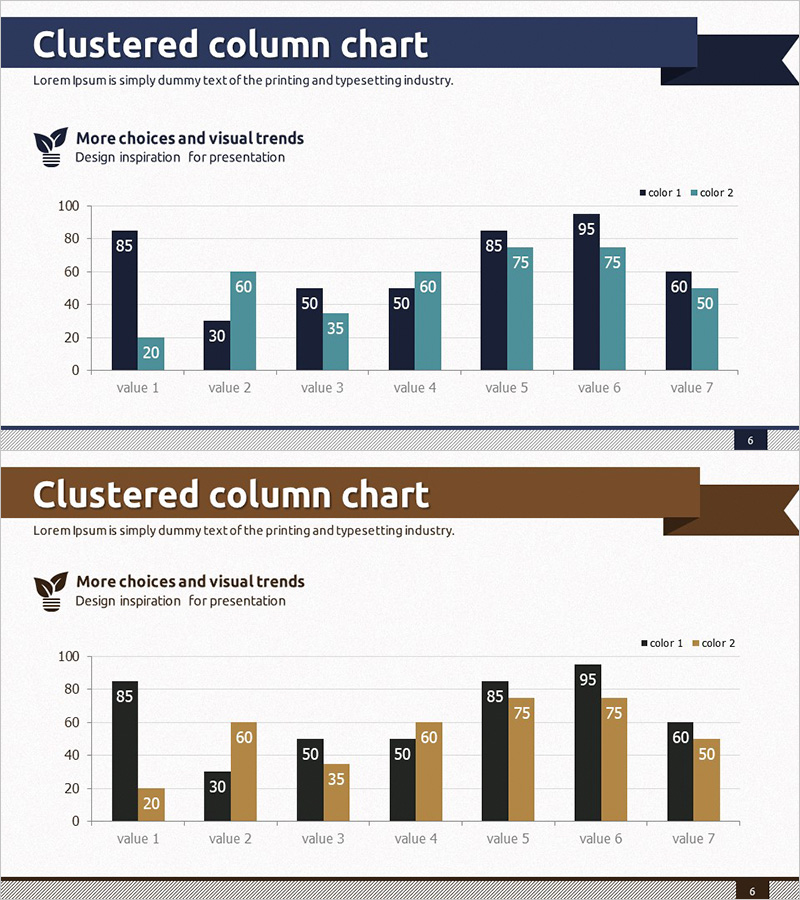
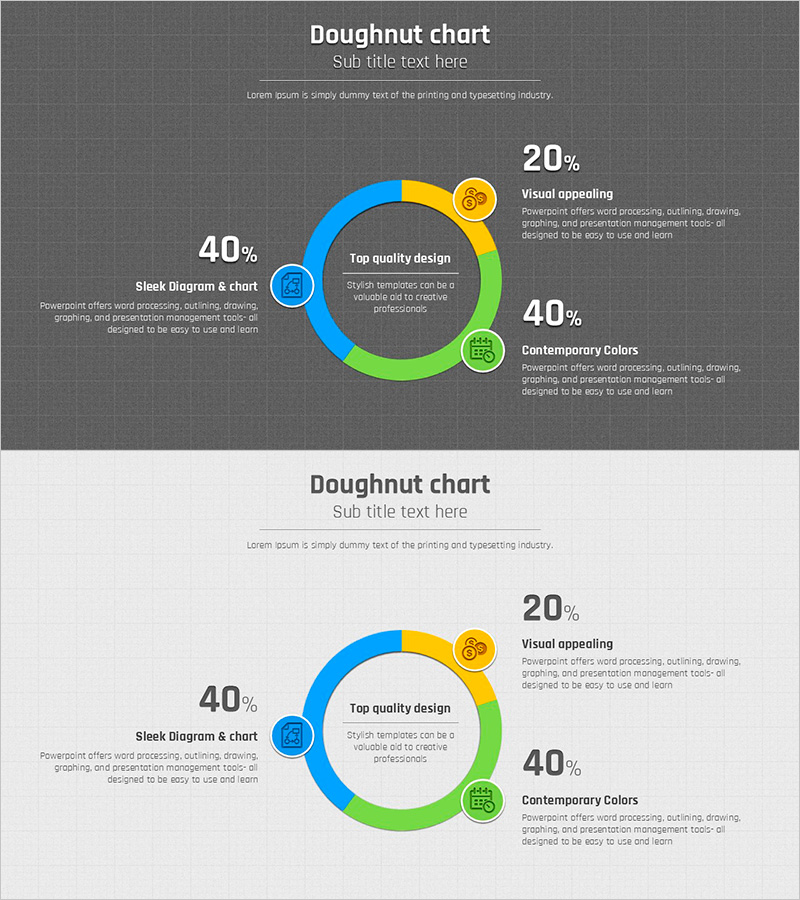
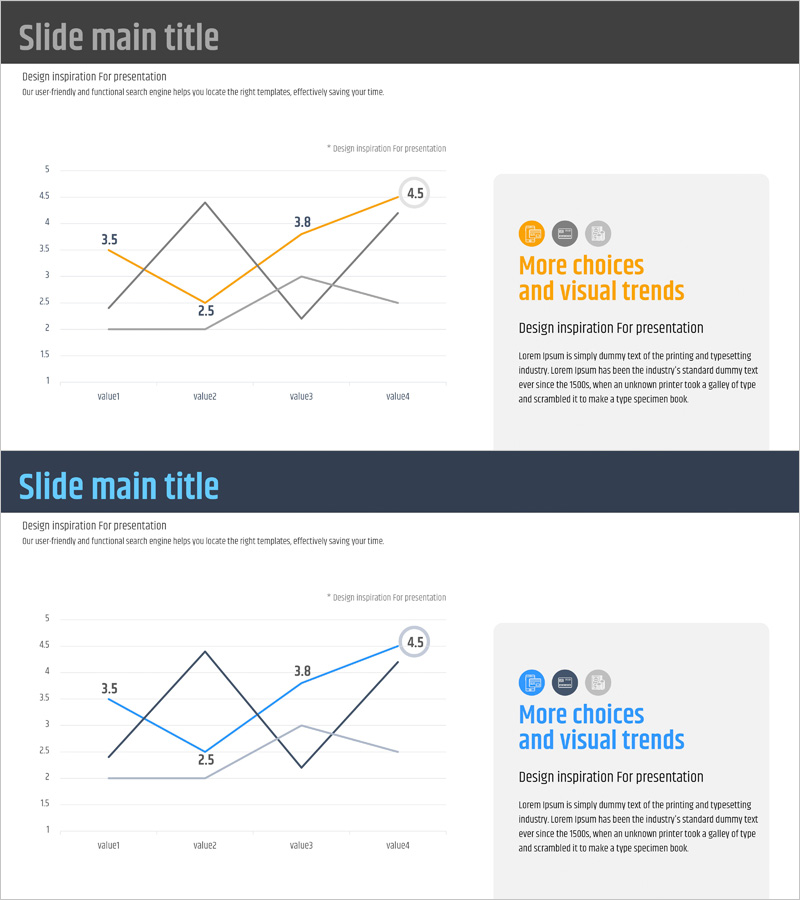
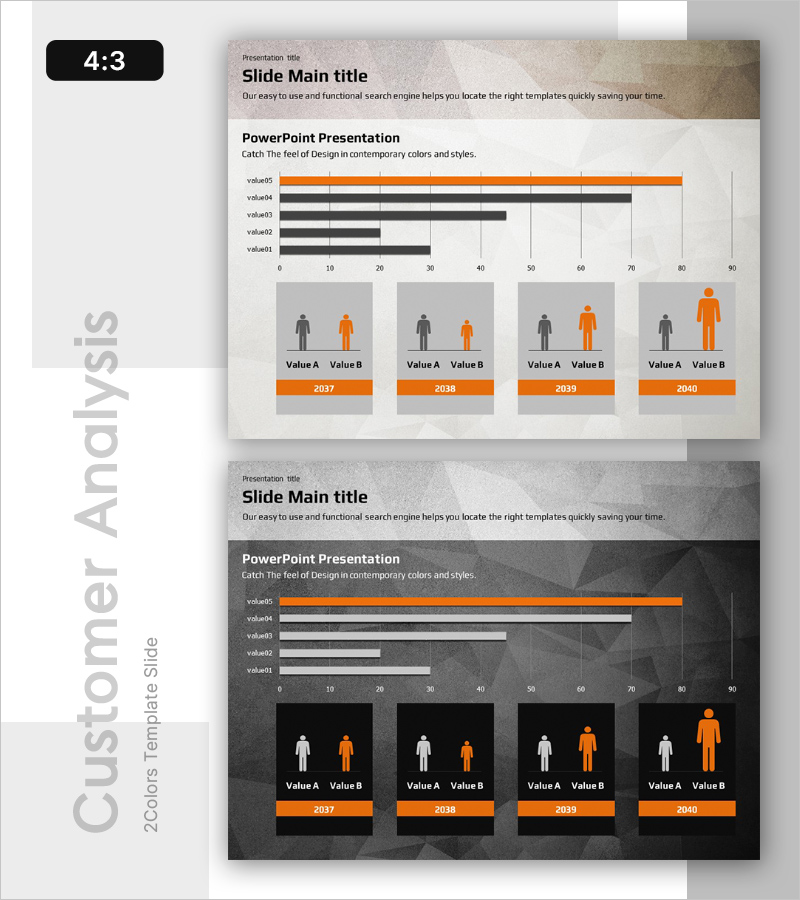
Graph
Market Trends in a Donut
RB0800021_6
- Last Update 12/21/2025
- File Size 0.9MB
- # of Slides 2
- File Format PPTX
- Slide Ratio 4:3
- Color
About the Product
This slide utilizes a donut chart to visually represent market trends. The harmonious blend of teal, blue, and navy colors conveys stability and trust, allowing for a quick grasp of the latest trends through concise data presentation. This visual design is suitable for investor presentations, planning documents, or strategic reports, enabling users to deliver and comprehend information easily.
Related Products
-
Market Trend Visualized with Vertical Bar Graph
#Market and Competitor Analysis #Graph #Competitor Analysis
-
Business Strategy Presentation Template with Doughnut Chart
#Business Introduction #Business Promotion Strategy #Graph
-
Competitive Advantage Analysis Graph – Market and Competitor Analysis
#Market and Competitor Analysis #Graph #Competitor Analysis
-
Customer Behavior Analysis by Country – Strategic Business Proposal
#Business Promotion Strategy #Market and Competitor Analysis #Diagram
