Graph
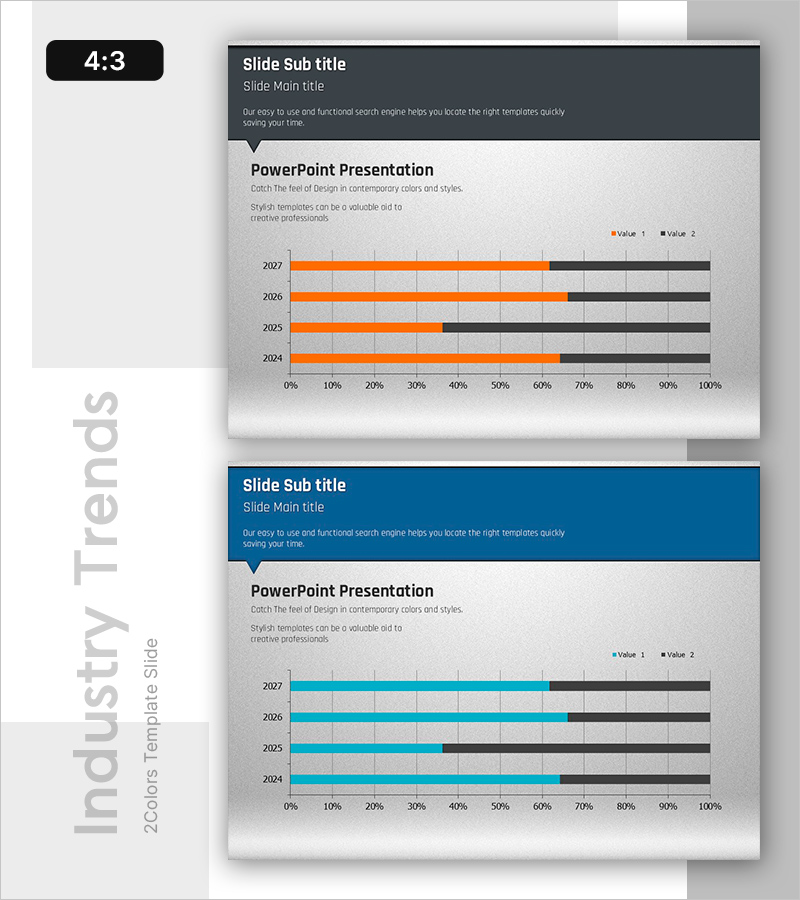
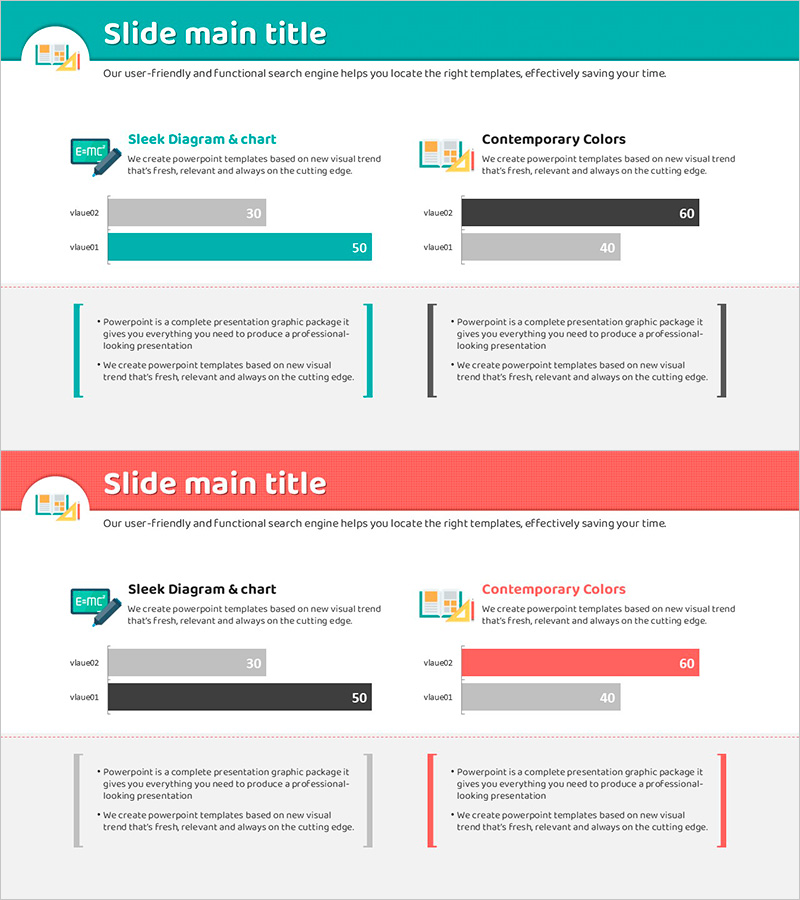
Business Trends Chart - Suitable for Strategic Planning
RB0800008-1_28
- Last Update 12/21/2025
- File Size 1.7MB
- # of Slides 2
- File Format PPTX
- Slide Ratio 4:3
- Color
About the Product
This slide features a graph format to clearly convey business trends. Utilizing the primary colors orange and blue enhances visual engagement for the data, allowing easy year-on-year comparison. With a straightforward yet effective design, this is ideal for business annual reports, marketing analyses, and strategy formulation presentations. The layout of the plot and graph provides a clear structure, enabling users to swiftly comprehend the data. With various editable elements (text and value data), the editing difficulty is rated as 'easy', allowing any user to utilize it effortlessly.
Related Products
-
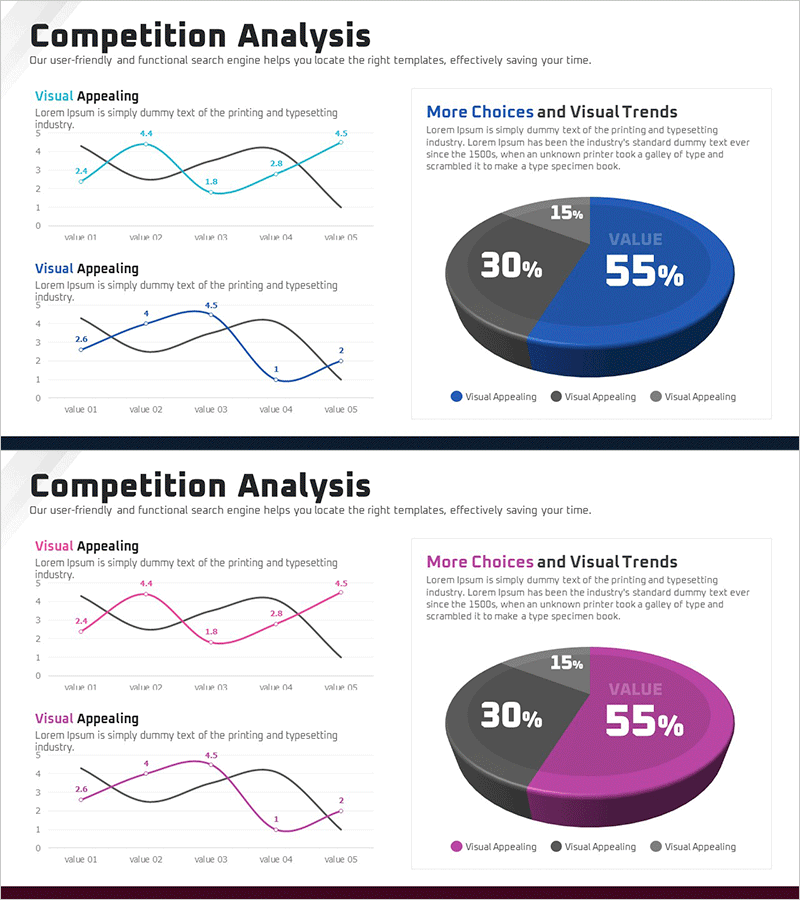
Competitor Comparison Analysis Graph
#Market and Competitor Analysis #Graph #Competitor Analysis
-
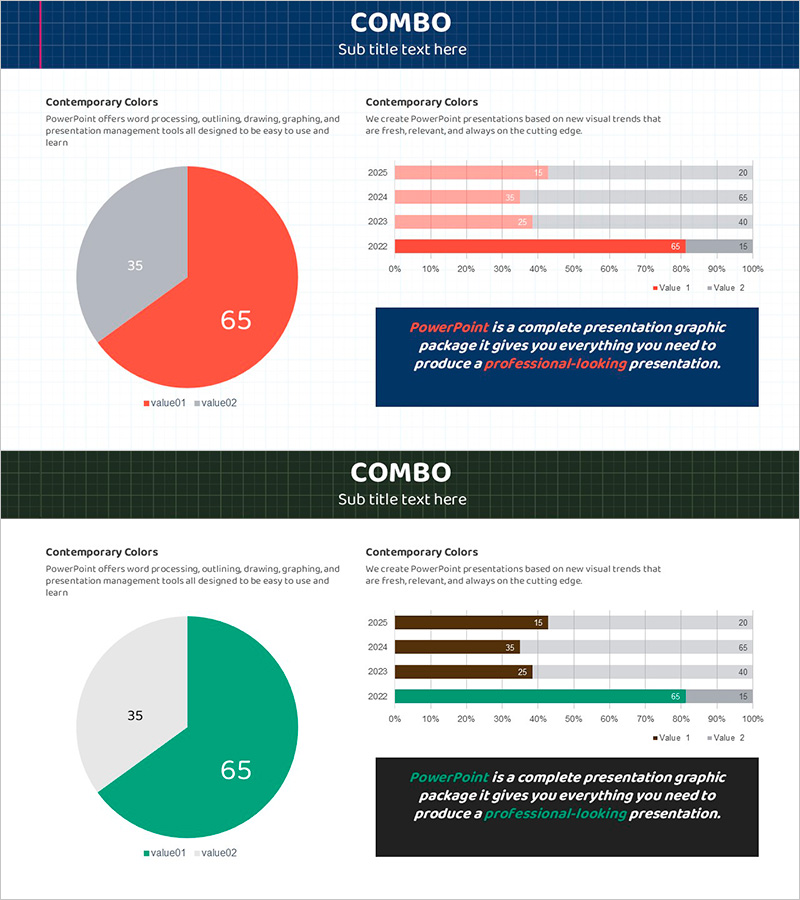
Red Green Detail Analysis Chart – Visualizing Market Share
#Market and Competitor Analysis #Graph #Market Status
-
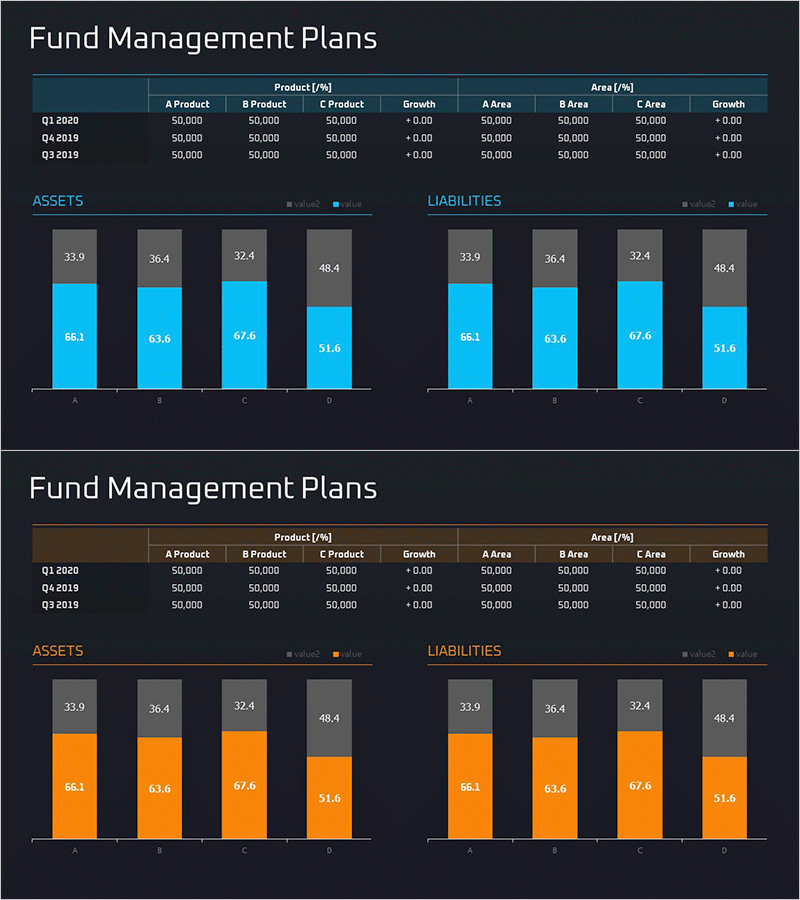
Detailed Graph of Fund Management Analysis – Emphasis on Financial Performance
#Marketing Plan and Strategy #Financial Plans and Performance #Diagram
-
Horizontal Bar Graph for Academic Achievement – Market and Competitive Analysis
#Market and Competitor Analysis #Graph #Market Analysis
