Market and Competitor Analysis
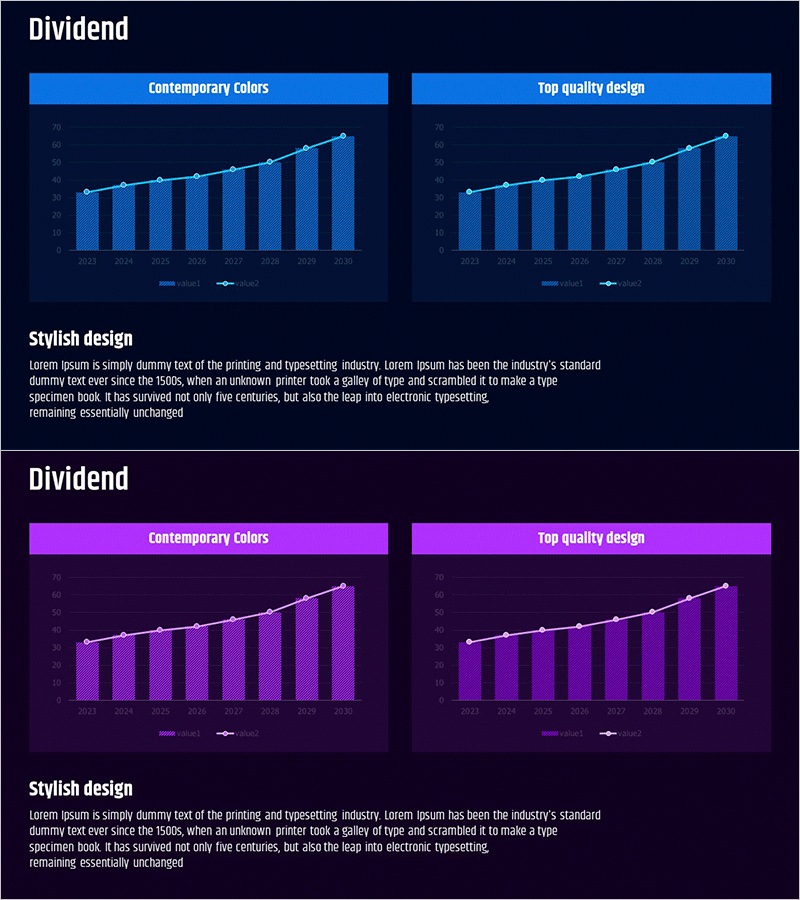
Sales Activity Comparison Graph - Market and Competitor Analysis
RM0600003_27
- Last Update 12/21/2025
- File Size 0.3MB
- # of Slides 2
- File Format PPTX
- Slide Ratio 16:9
- Color
Keywords
About the Product
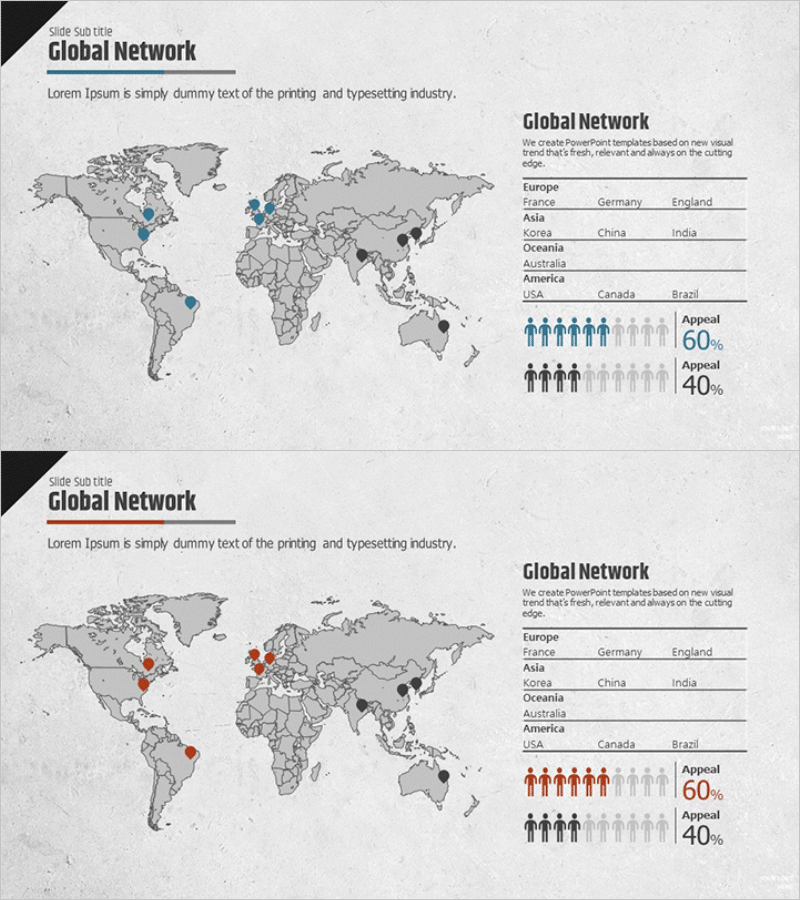
This slide features a sales activity comparison graph designed to convey market trends and competitor analysis intuitively. The blue and purple tones provide professionalism and trust, while the structure effectively compares two data sets. This graph is ideal for visualizing sales performance analysis and predicting investment returns, making it valuable for executives and investors. The text and data are easily editable, with an overall editing difficulty rated as 'easy'.
Related Products
-
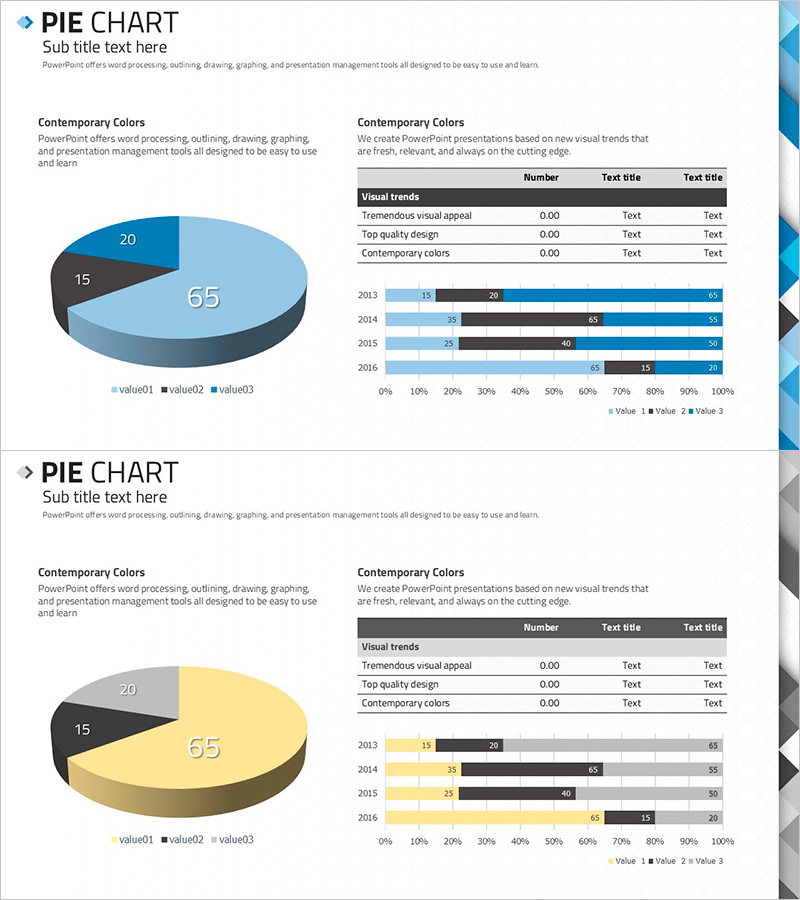
ABSTRACT PATTERN Presentation PIE CHART – Clearly Visualize Market Share
#Market and Competitor Analysis #Financial Plans and Performance #Diagram
-
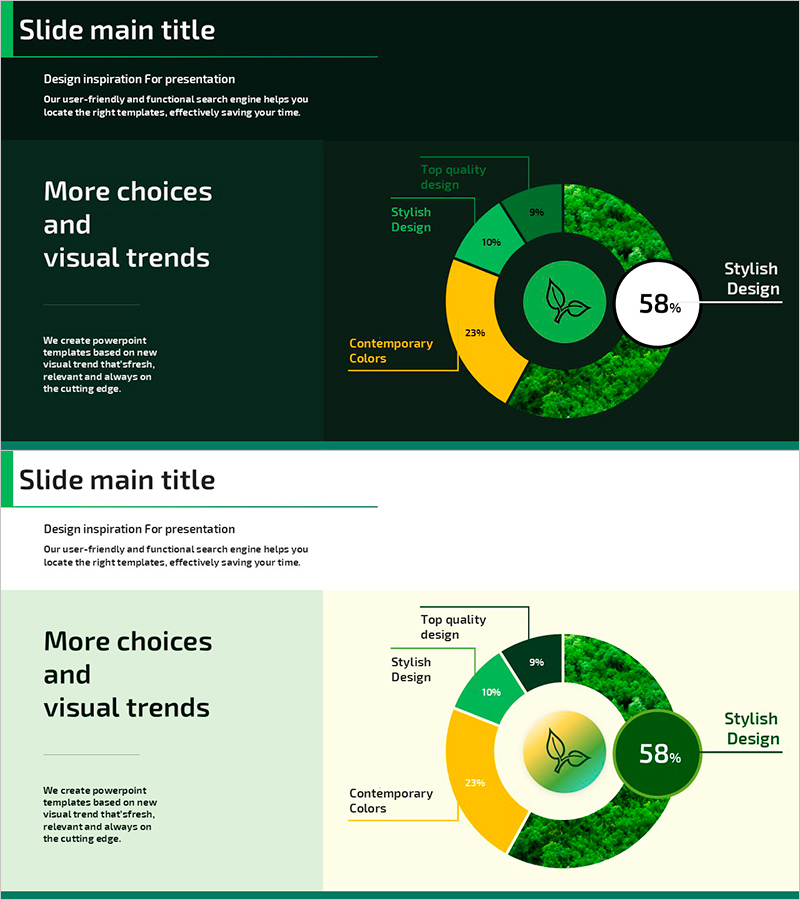
Circular Graph Slide Emphasizing Plant's Habitat
#Market and Competitor Analysis #Graph #Market Status
-
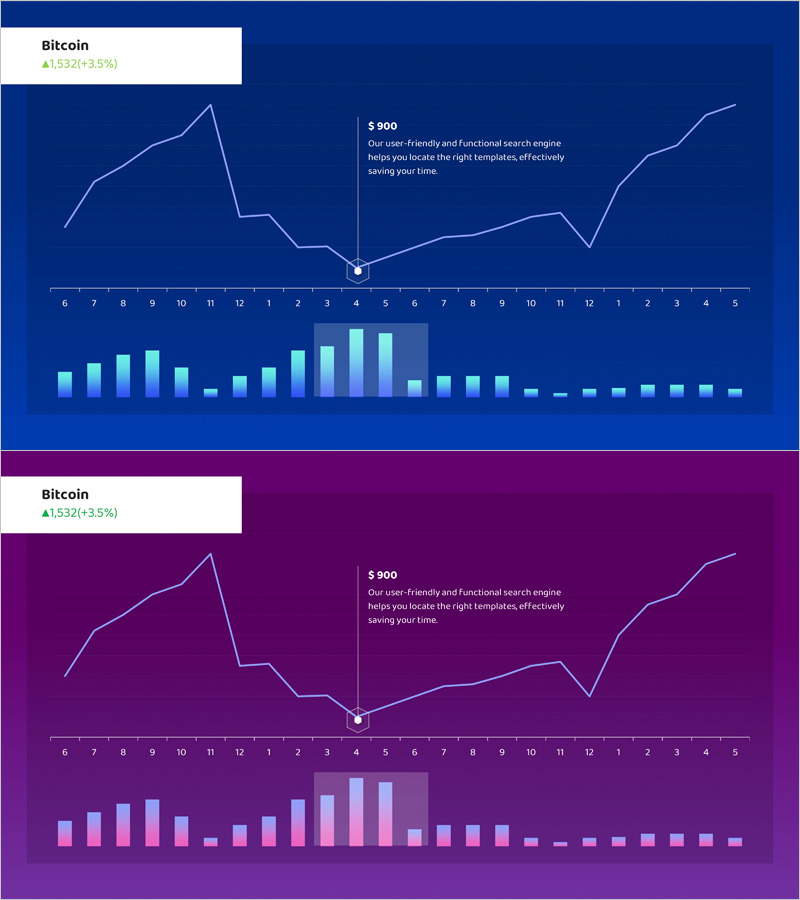
Stock Market Trend Graph
#Market and Competitor Analysis #Graph #Market Analysis
-
Global User Analysis Graph
#Company Introduction #Market and Competitor Analysis #Graph
