Circular Graph Slide Emphasizing Plant's Habitat
RJ0600099_6
- Last Update 07/18/2025
- File Size 0.9MB
- # of Slides 2
- File Format PPTX
- Slide Ratio 16:9
- Color
Keywords
About the Product
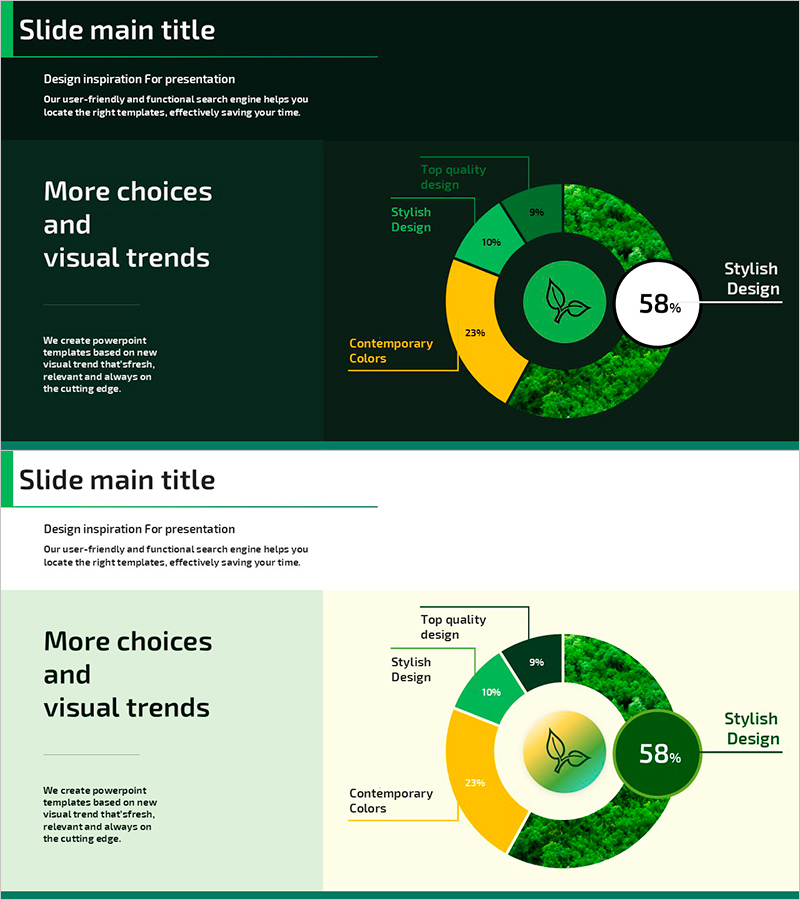
A PowerPoint slide that visualizes plant habitat distribution using a circular graph design. The dark green background features a bright green, yellow, and white donut-shaped chart that intuitively represents data proportions. The left side contains a title and descriptive text area, while the right side displays a large circular graph with legend labels in a two-column layout. This presentation slide is ready to use for reports requiring ratio data emphasis, such as environmental analysis, market share, and resource distribution.
Usage Points
-
Main Usage
Visualizes ratio data through a circular graph to clearly communicate market share, environmental distribution, and resource allocation. The dark green background with bright color contrast enhances data emphasis, while the donut chart structure highlights key metrics (58%) in the center.
-
How to Use
Enter title and description in the left text area, then modify the circular graph sections and legend labels to match your data. Use this slide in environmental analysis, marketing overview, and business analysis sections to convey ratio-based insights.
-
Recommended For
Ideal for environmental research, ecosystem analysis, market research, and business analysis presentations. Recommended for executives, analysts, and marketing professionals who need data-driven decision-making presentations.
-
Slide Structure
Two-slide layout with left text area (one title, one description text) and right donut-shaped circular graph (four sections plus center metric display) with four legend labels. Optimized for 16:9 widescreen format with balanced composition.
Related Products
-

Furniture Donut Charts – Market Share Analysis
#Market and Competitor Analysis #Graph #Market Status
-

Market Share Analysis with Donut Chart – In-depth Understanding of Market and Competitors
#Market and Competitor Analysis #Graph #Market Status
-

Mint & Orange Pie Chart Analysis - Market Status and Share
#Market and Competitor Analysis #Graph #Market Status
-

Donut Chart for Market Share Analysis Slide
#Market and Competitor Analysis #Graph #Market Status
