Business Management
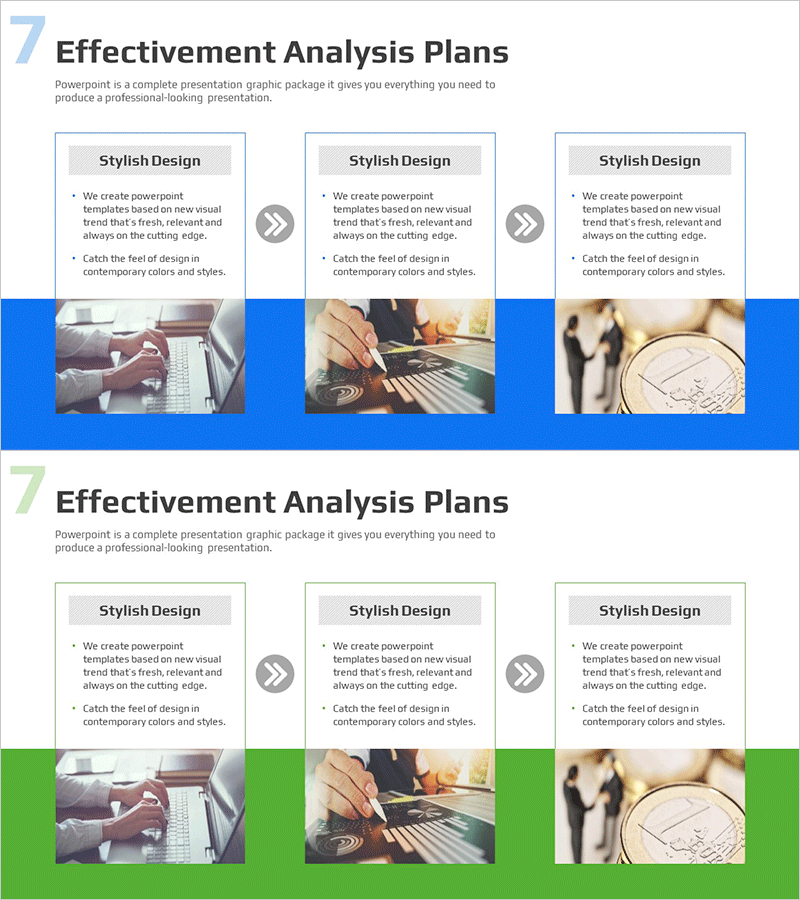
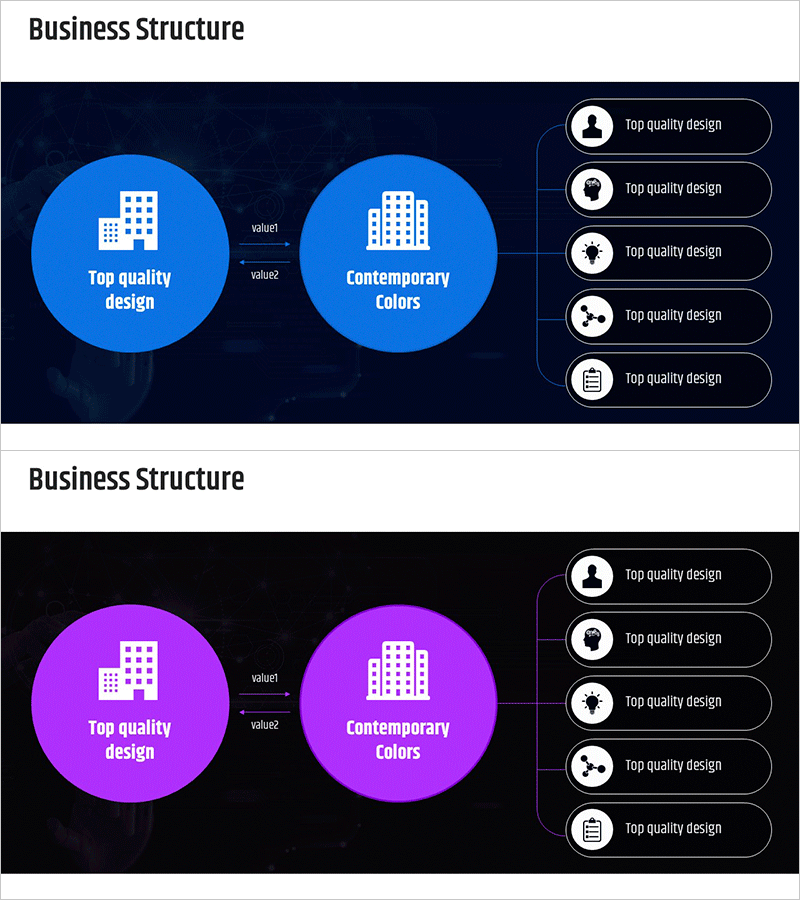
Marketing Effectiveness Analysis Process Diagram
RM0400015_32
- Last Update 12/21/2025
- File Size 0.4MB
- # of Slides 2
- File Format PPTX
- Slide Ratio 16:9
- Color
Keywords
About the Product
This slide visualizes the marketing effectiveness analysis process through a linear flow diagram. The clear and intuitive design effectively supports the development and evaluation of marketing strategies, helping users to easily understand each step. The use of blue and green colors conveys trust and stability, while a well-structured layout ensures clear communication of information. The aim is to help users clearly comprehend and share their strategies.
Related Products
-
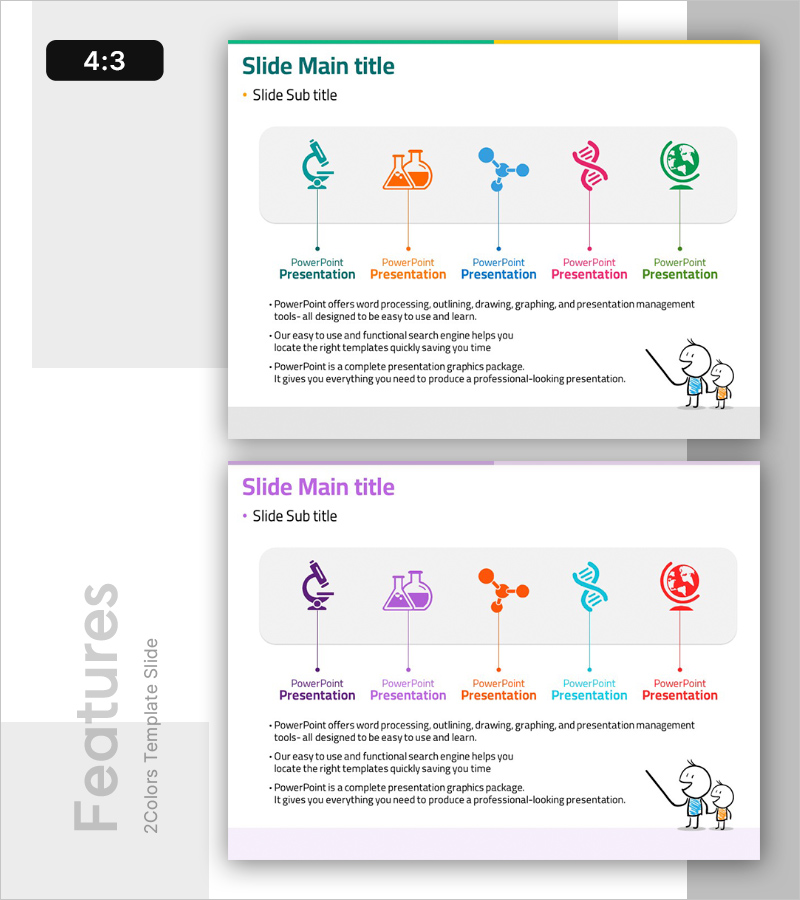
Key Characteristics of Scientific Elements – Analyzing Experimental Factors
#Product/Service #Diagram #Features
-
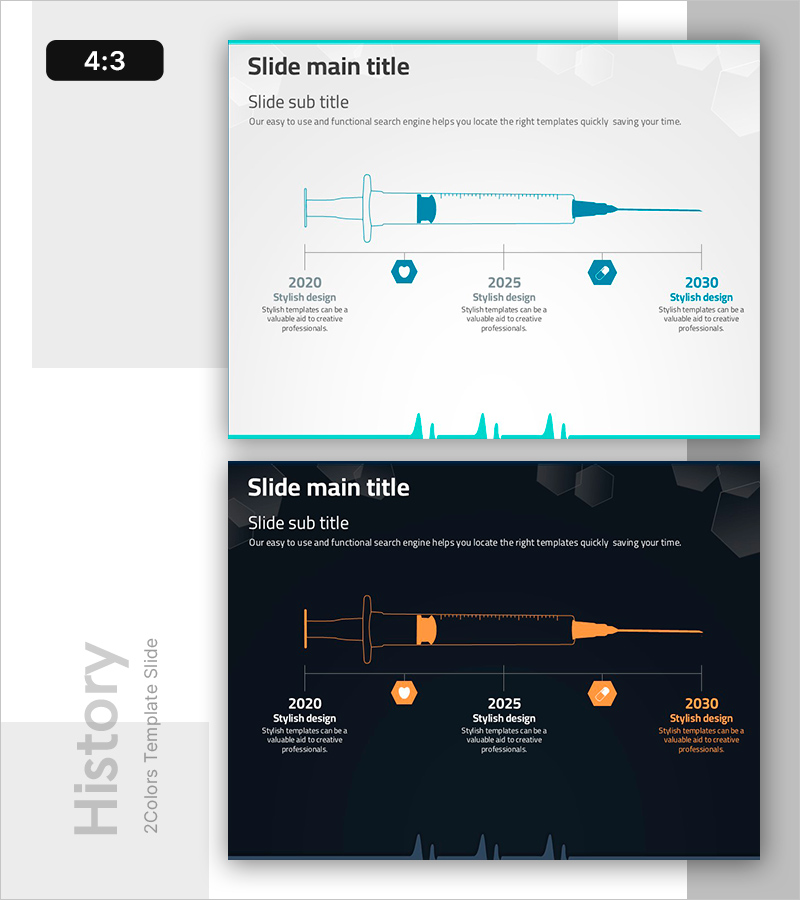
Syringe History Infographic - Product Development and Innovation
#Company Introduction #Product/Service #Diagram
-
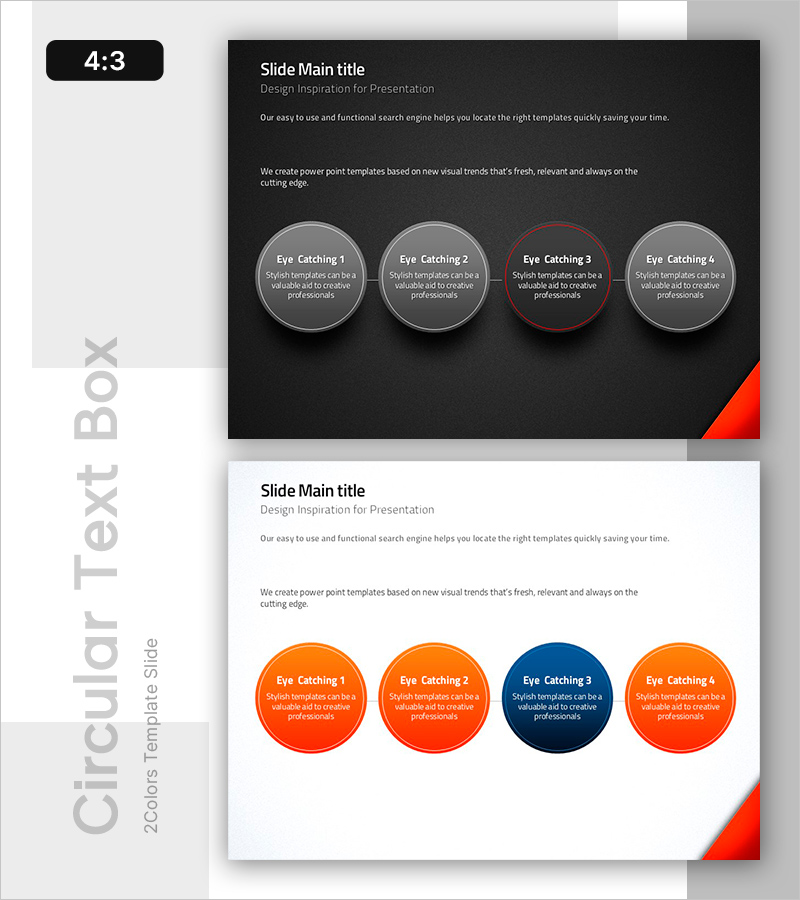
Keyword Box Connection Diagram – Effective Information Delivery
#Product/Service #Business Vision and Strategy #Operation Plan
-
Business Structure Tree Diagram – Vision and Strategy
#Business Introduction #Business Vision and Strategy #Diagram
