Key Characteristics of Scientific Elements – Analyzing Experimental Factors
RB0300013_4
- Last Update 03/10/2025
- File Size 0.6MB
- # of Slides 2
- File Format PPTX
- Slide Ratio 4:3
- Color
Keywords
- #Content-Based Slides
- #Design-Based Slides
- #Product/Service Introduction
- #Diagram
- #Features
- #Composition
- #Cluster
- #Chain Diagram
- #4:3
- #connection diagram PowerPoint
- #scientific element analysis presentation
- #5-node diagram slide
- #educational presentation diagram
- #experimental element visualization PPT
About the Product
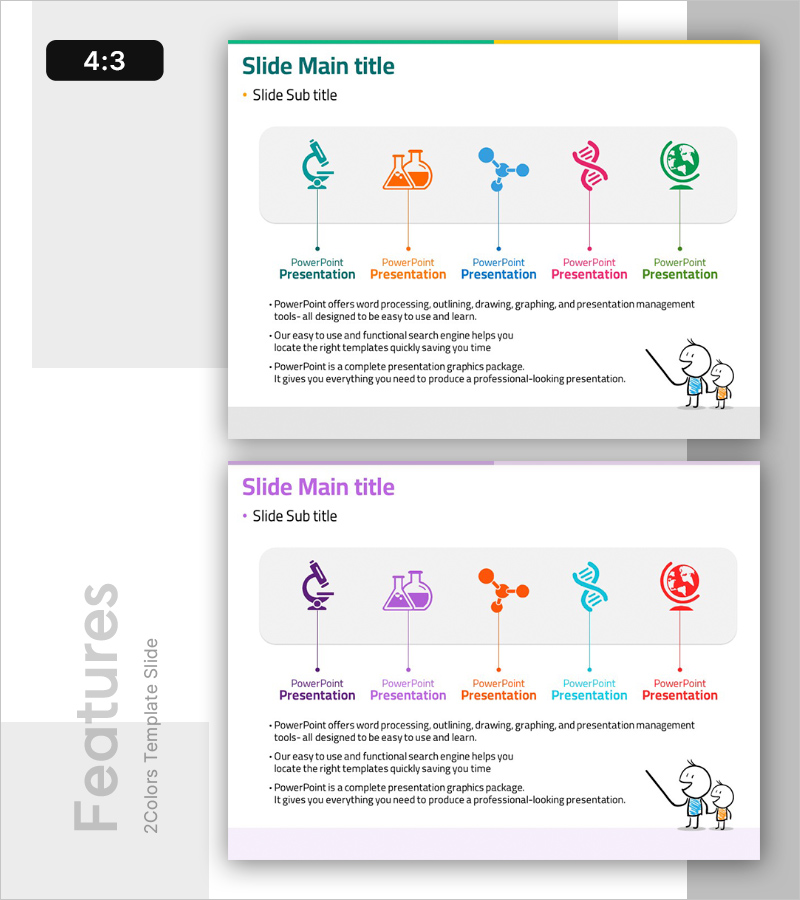
A 5-node connection diagram PowerPoint slide optimized for science and education presentations. Features microscope, chemistry, molecule, DNA, and globe icons to visualize experimental elements, with each node connected by vertical lines expressing hierarchical relationships. Multi-colored nodes (teal, orange, blue, pink, green) distinguish each item, enabling students, researchers, and educators to intuitively understand complex scientific concepts. Designed in 4:3 ratio with 2 slides, ready for immediate editing and direct application to educational seminars, academic presentations, and science planning documents.
Usage Points
-
Main Usage
Used in science and education fields to express experimental elements, key characteristics, and concept relationships hierarchically. Microscope, chemistry, molecule, DNA, and globe icons transform abstract concepts into concrete images, while vertical connection lines clarify logical flow between elements.
-
How to Use
Applied as a topic analysis slide in educational seminars, academic presentations, science planning documents, and research reports. Edit node text and icons to fit biology, chemistry, physics, environmental science, and other disciplines; adjust colors to match brand identity.
-
Recommended For
Recommended for science teachers, university instructors, researchers, educational institution managers, and science-related corporate marketing teams explaining scientific concepts to students, parents, and investors. Particularly effective for STEM education, academic conferences, and science museum educational programs.
-
Slide Structure
2-slide composition. First slide features 5 colored icons (teal, orange, blue, pink, green) with text labels in a gray box at top, with vertical connection lines from each node to description area below. Second slide presents identical structure in purple theme variant, offering color options.
Related Products
-

Body Structure Description Diagram - Infographic Design
#Product/Service Introduction #Diagram #Other
-

Characteristics of Each Ingredient – Infographic for the Table
#Product/Service Introduction #Diagram #Features
-

Visual Infographic Slide on Tobacco Characteristics
#Product/Service Introduction #Diagram #Other
-

Four Core Elements of Genetic Research in Biotechnology
#Product/Service Introduction #Diagram #Features
