Company Introduction
Data-driven Market Analysis Strategy – Sleek Graph Slide
RM0300016_17
- Last Update 12/21/2025
- File Size 1.4MB
- # of Slides 2
- File Format PPTX
- Slide Ratio 16:9
- Color
Keywords
About the Product
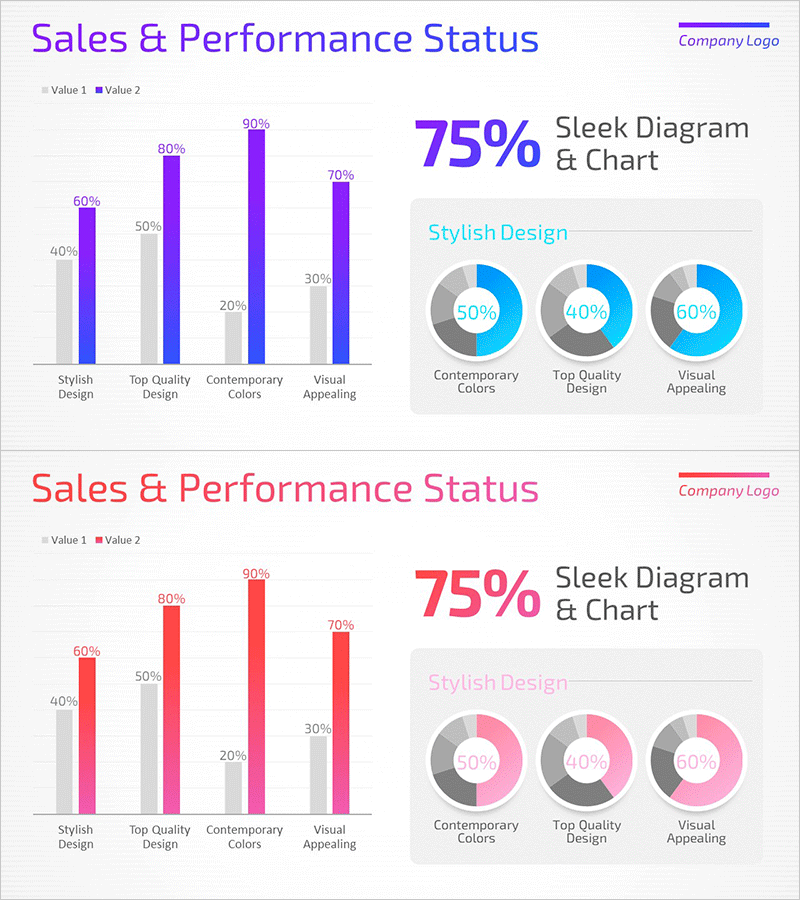
This slide visually represents an effective data-driven market analysis strategy. It uses various visual elements like vertical and horizontal bar graphs and donut charts to intuitively convey sales and performance status. The harmonious color scheme of purple and red emphasizes professionalism and is suitable for corporate presentations and reports. Text and chart areas are easy to edit, enabling quick application in various business scenarios.
Related Products
-
Region Display Donut Graph – Infographic for Market Analysis
#Company Introduction #Market and Competitor Analysis #Other
-
Ranking of Vegetables that Children Dislike – Fun and Engaging
#Product/Service #Market and Competitor Analysis #Diagram
-
Key Performance Analysis Bar Graph – Visualization of KPIs
#Company Introduction #Market and Competitor Analysis #Graph
-

Layout Design PowerPoint – Attractive Column Text Template
#Company Introduction #Market and Competitor Analysis #Other
