Region Display Donut Graph – Infographic for Market Analysis
RJ0500030_10
- Last Update 06/15/2025
- File Size 0.6MB
- # of Slides 2
- File Format PPTX
- Slide Ratio 16:9
- Color
Keywords
About the Product
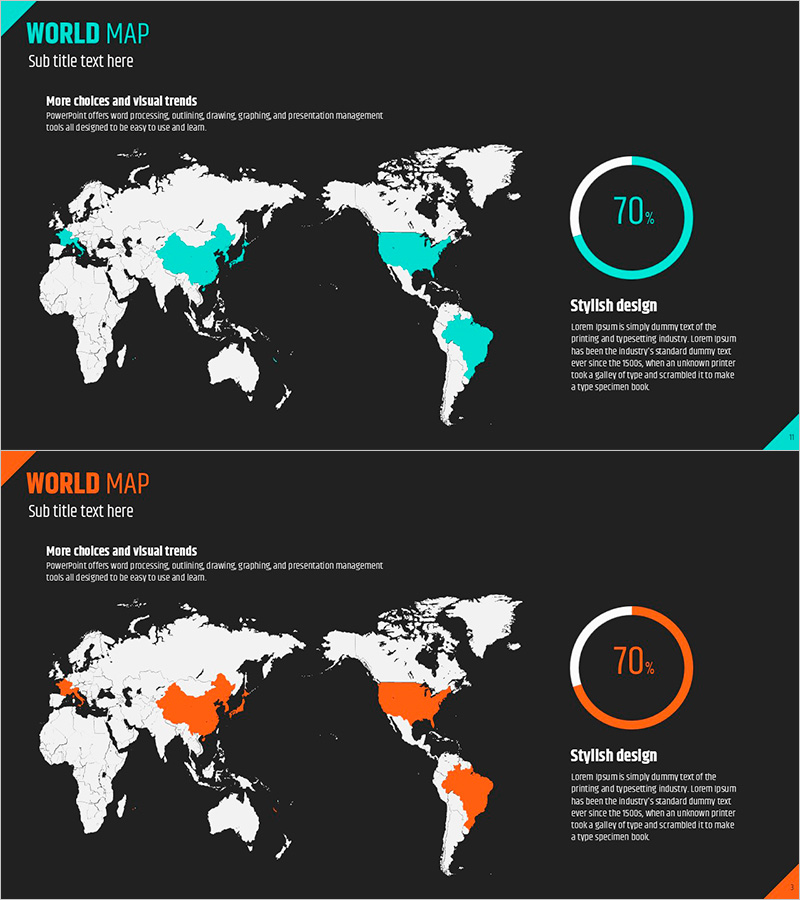
A PowerPoint slide designed for global market analysis and regional target marketing visualization. Features a dark background with a white world map where specific regions are highlighted in cyan or orange. Two color versions are provided to match different presentation themes. A circular progress graph (70%) on the right side displays regional market share, growth rates, or achievement metrics. Ample text description area allows clear communication of market conditions, competitive analysis, and global expansion strategies. Delivered as a 16:9 widescreen PPTX file ready for immediate editing. Ideal for investor presentations, business reports, and marketing strategy documents.
Usage Points
-
Main Usage
Designed to present global market conditions and regional target markets at a glance. Highlighted regions in contrasting colors convey market share, growth rates, and market entry status intuitively, while the circular graph on the right simultaneously displays quantitative data.
-
How to Use
Use in investor presentations when explaining global business strategy, or in business reports to visualize regional sales and customer distribution. Enter market analysis content and competitive landscape in the text area, then edit the graph values to reflect actual data.
-
Recommended For
Presentations to executives and investors, global business strategy meetings, regional marketing plan documents, international expansion reports, and market/competitive analysis sections. Particularly effective for multinational corporations, import-export companies, and global service providers presenting strategic initiatives.
-
Slide Structure
The slide layout includes a title area in the upper left, a world map with highlighted regions in the center, a circular progress graph in the upper right, and a text description area in the lower right. Two text input fields (title and subtitle) plus one description text area create clear information hierarchy. Two color versions (cyan and orange) allow adaptation to various presentation contexts and corporate branding requirements.
Related Products
-

Target Market Global Network Map – Visualizing Business Strategy
#Company Introduction #Market and Competitor Analysis #Other
-

Target Market Goal Map for Global Market Analysis
#Company Introduction #Market and Competitor Analysis #Other
-

Black Blue Global Map for Global Network
#Company Introduction #Market and Competitor Analysis #Other
-

Global Network Map – Market Analysis and Opportunity Exploration
#Company Introduction #Market and Competitor Analysis #Other
