
Market and Competitor Analysis
Collaborative Business Market Revenue Analysis Graph - Data-Driven Insights
RM0200010_13
- Last Update 12/21/2025
- File Size 0.3MB
- # of Slides 2
- File Format PPTX
- Slide Ratio 16:9
- Color
Keywords
About the Product
This slide visualizes the revenue analysis of collaborative businesses. Utilizing a horizontal bar graph design, it clearly presents data and trends, facilitating audience comprehension and analysis. The harmonious color scheme of blue and purple conveys professionalism and sophistication. This slide is ideal for investor presentations, market research reports, or business strategy meetings.
Related Products
-
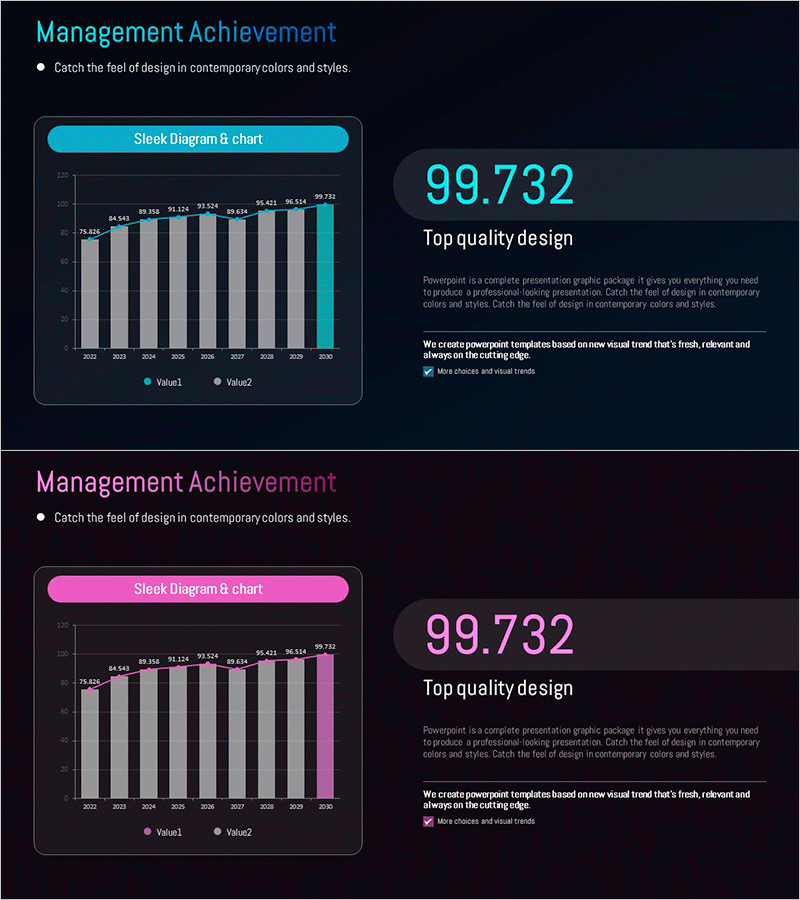
Management Performance Analysis Mixed Chart – Visualizing Strategies and Achievements
#Business Promotion Strategy #Market and Competitor Analysis #Graph
-
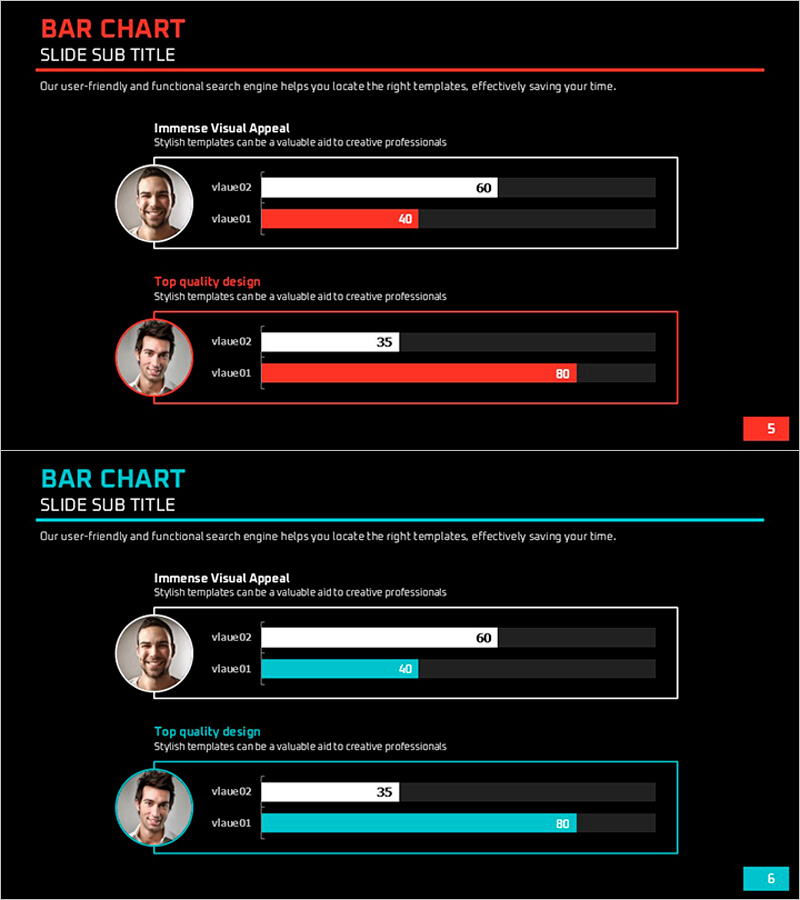
Manpower Analysis Bar Chart – Optimal Solution for Data Visualization
#Company Introduction #Market and Competitor Analysis #Graph
-
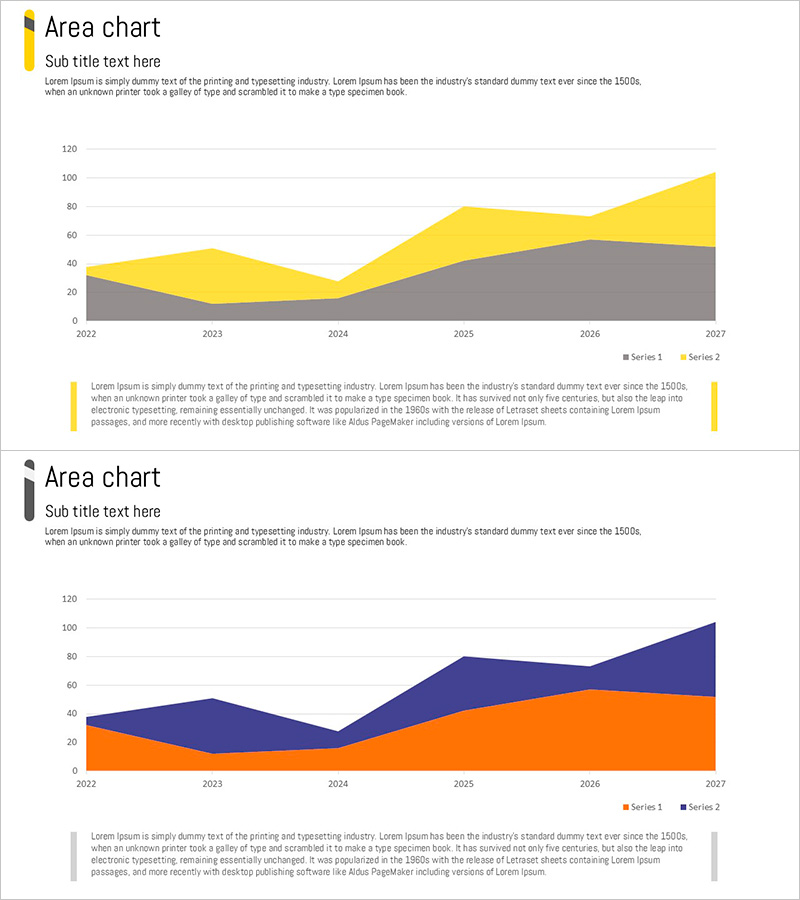
Yellow Orange Area Chart – Visualization for Market Analysis
#Market and Competitor Analysis #Graph #Other
-
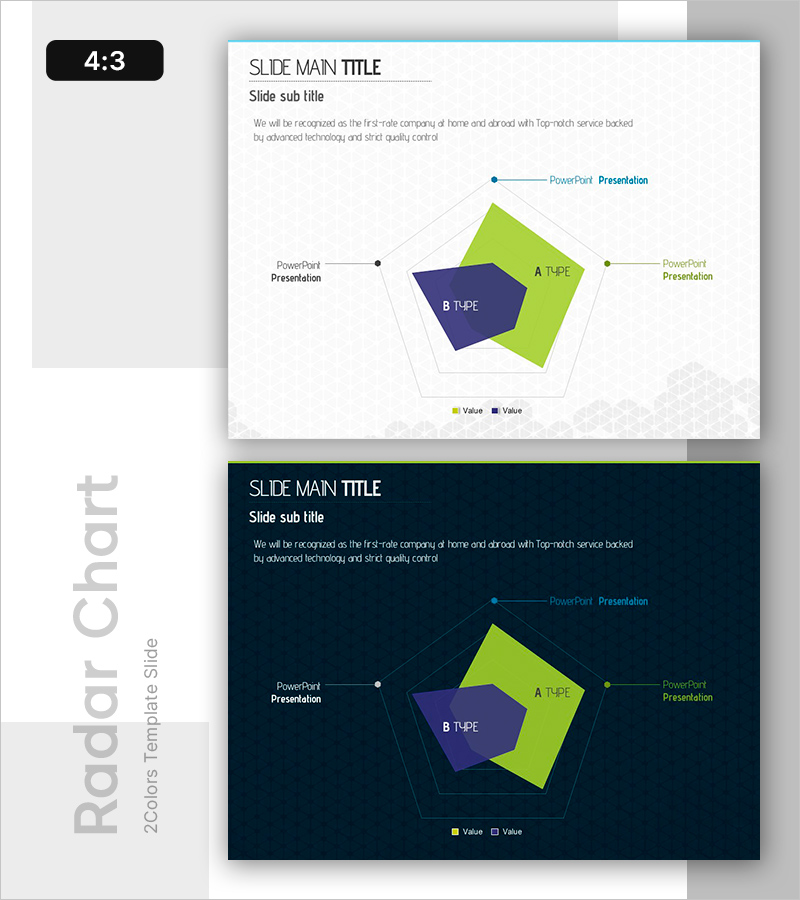
Design Pattern Template Radar Chart Analysis
#Product/Service #Graph #Features
