Yellow Orange Area Chart – Visualization for Market Analysis
RJ0900007_16
- Last Update 08/17/2025
- File Size 0.1MB
- # of Slides 2
- File Format PPTX
- Slide Ratio 16:9
- Color
Keywords
About the Product
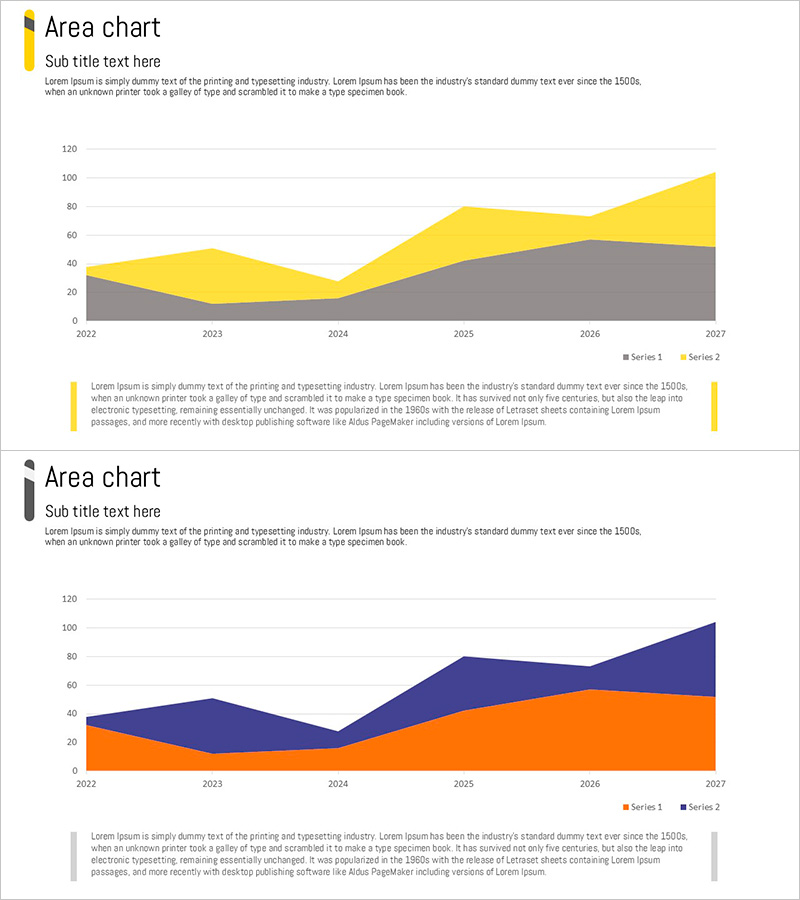
An area chart PowerPoint slide optimized for market analysis and financial data presentation. This two-series stacked area chart in yellow and orange visualizes time-series data trends from 2022 to 2027 with clear, intuitive representation. The 16:9 widescreen 2-slide set includes title, subtitle, and description text areas alongside fully editable chart data. Perfect for presenting market size changes, revenue trends, customer growth, market share fluctuations, and other key business metrics in professional presentations.
Usage Points
-
Main Usage
Visualize time-series data such as market size changes, revenue trends, and customer growth using a stacked area chart. The two-series comparison enables simultaneous understanding of overall scale and individual trends, making complex data accessible and persuasive.
-
How to Use
Insert into business plans, investor pitch decks, and quarterly performance reports in the market analysis section. Replace chart data and legend with your own figures, then edit title and description text for your presentation. Yellow and orange colors convey positive growth messaging.
-
Recommended For
Marketing managers, financial analysts, executives, management consultants, and startup founders presenting market conditions and growth trajectories. Ideal for situations requiring multi-series data comparison and trend analysis across multiple years.
-
Slide Structure
Two-slide set with title area (main title and subtitle), descriptive text box, and a stacked area chart displaying two data series in yellow and orange. The chart represents six years of data (2022-2027) with legend and Y-axis value labels included for easy customization.
Related Products
-

Market Analysis Area Graph – Risk Reduction
#Market and Competitor Analysis #Graph #Other
-

Curve Graph Slide for Analyzing Regional Figures – Effective Data Delivery
#Market and Competitor Analysis #Graph #Other
-

Population Change Area Graph Visual
#Market and Competitor Analysis #Graph #Other
-

Market Analysis Slide with Line Charts on TV
#Market and Competitor Analysis #Graph #Other
