Market and Competitor Analysis
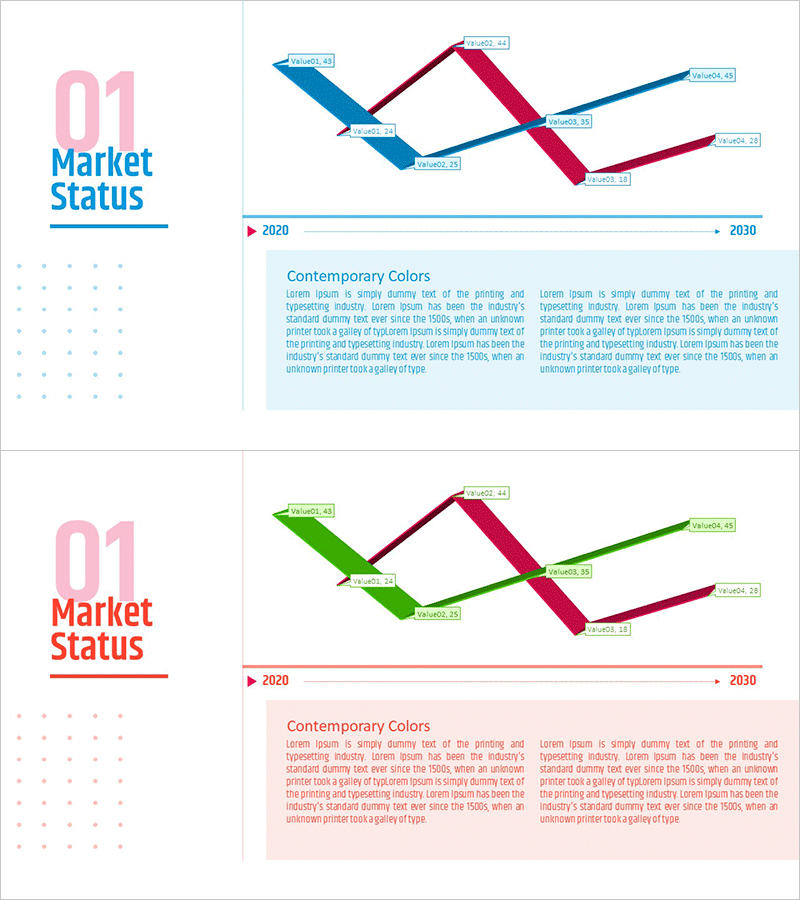
Year Comparison 3D Line Graph – Competitor Analysis and Market Status
RM0100010_10
- Last Update 12/21/2025
- File Size 1MB
- # of Slides 2
- File Format PPTX
- Slide Ratio 16:9
- Color
Keywords
About the Product
This slide utilizes a 3D line graph to compare market status and competitor data. The vivid graph design, combined with the blue and red colors, effectively highlights data points. It visualizes annual growth, demonstrating excellent impact for analytical information delivery. This template is suitable for business settings such as marketing strategy meetings or investment proposals, supporting decision-making through effective materials.
Related Products
-
Line Graph and Key Messages – Market Outlook Analysis
#Market and Competitor Analysis #Graph #Future Outlook
-
Budget Allocation by Strategic Focus
#Business Introduction #Market and Competitor Analysis #Graph
-
Triangular Prism Graph for Visualizing Market Status – Insights and Analysis
#Market and Competitor Analysis #Graph #Other
-

Startup Company Market Analysis Graph – Competition and Growth
#Market and Competitor Analysis #Diagram #Graph
