Market and Competitor Analysis
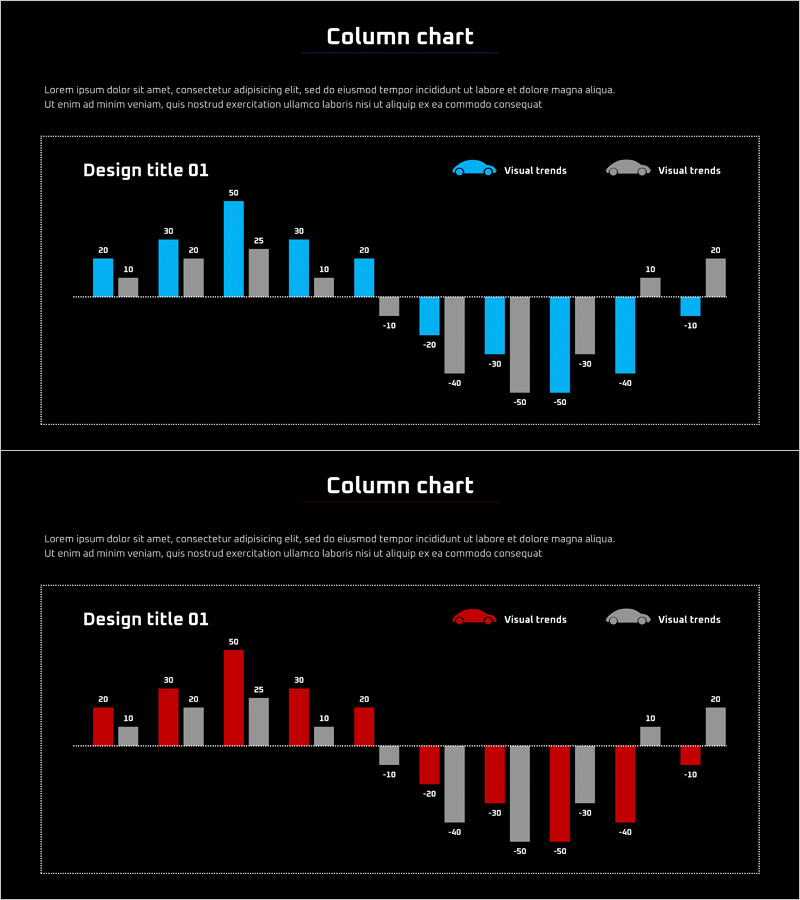
Competitor Brand Product Comparison Analysis Graph
RJ0400042_7
- Last Update 12/21/2025
- File Size 0.2MB
- # of Slides 2
- File Format PPTX
- Slide Ratio 16:9
- Color
Keywords
About the Product
This slide utilizes horizontal and vertical bar graphs to analyze competitor brand products. It effectively visualizes the performance and comparison metrics between brands, ideal for developing business strategies and analyzing market trends. The combination of blue, red, and black colors adds a touch of sophistication while providing reliable data presentation. Users can easily convey their competitor analysis results through this PowerPoint slide, with easy replacements for text and data, making it adaptable to various presentation scenarios.
Related Products
-
Visualizing Sales Performance Trends with a Bar Chart – Market Competitor Analysis
#Market and Competitor Analysis #Graph #Industry Trends
-
Space Industry Development Status Graph – Capturing the Future of Industry
#Product/Service #Business Introduction #Graph
-
Horizontal Bar Chart for Performance Visualization – Driving Business Momentum
#Business Promotion Strategy #Marketing Plan and Strategy #Graph
-
Revenue Growth Target Graph – Effective Performance Presentation
#Business Promotion Strategy #Graph #Revenue Outlook and Expected Effects
