Graph
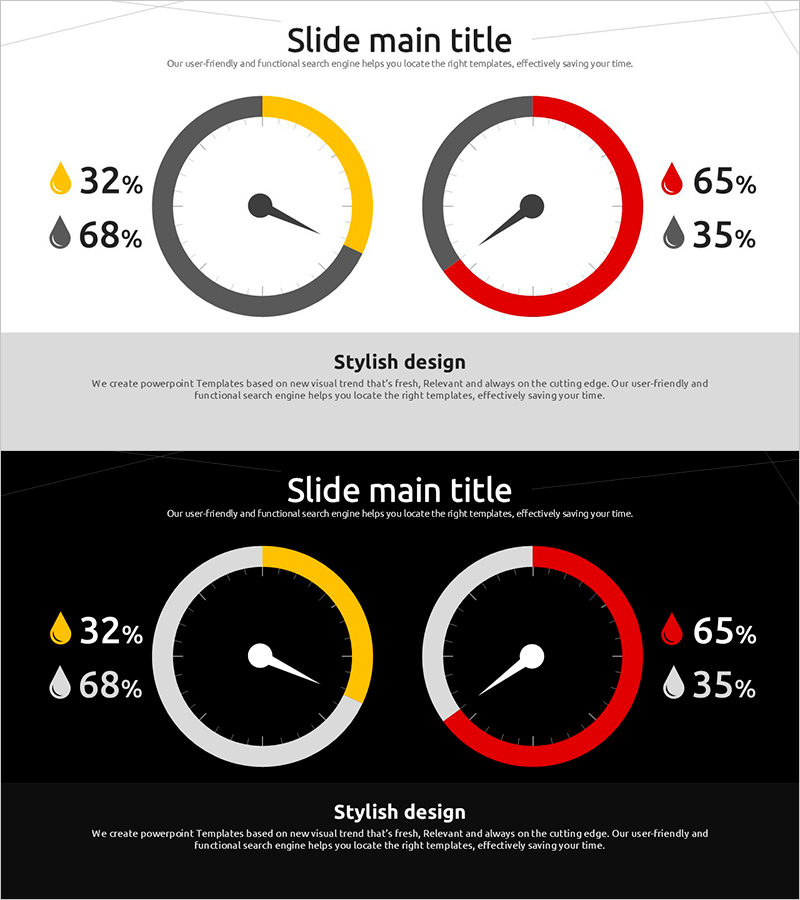
Donut Chart on the Motor Vehicle Instrument Panel – Intuitive Data Visualization
RJ0800023_22
- Last Update 12/21/2025
- File Size 0.5MB
- # of Slides 2
- File Format PPTX
- Slide Ratio 16:9
- Color
Keywords
About the Product
This slide features a donut chart styled as a motor vehicle instrument panel. With contrasting yellow and red colors, it effectively visualizes data ratios of 32% and 68%, as well as 65% and 35%. This intuitive design allows for quick comprehension of critical data, making it highly suitable for business reports or presentations. Easy to edit with a difficulty rating of 'easy', this infographic-style slide can be applied across various fields and captures the audience's attention with its modern look.
Related Products
-
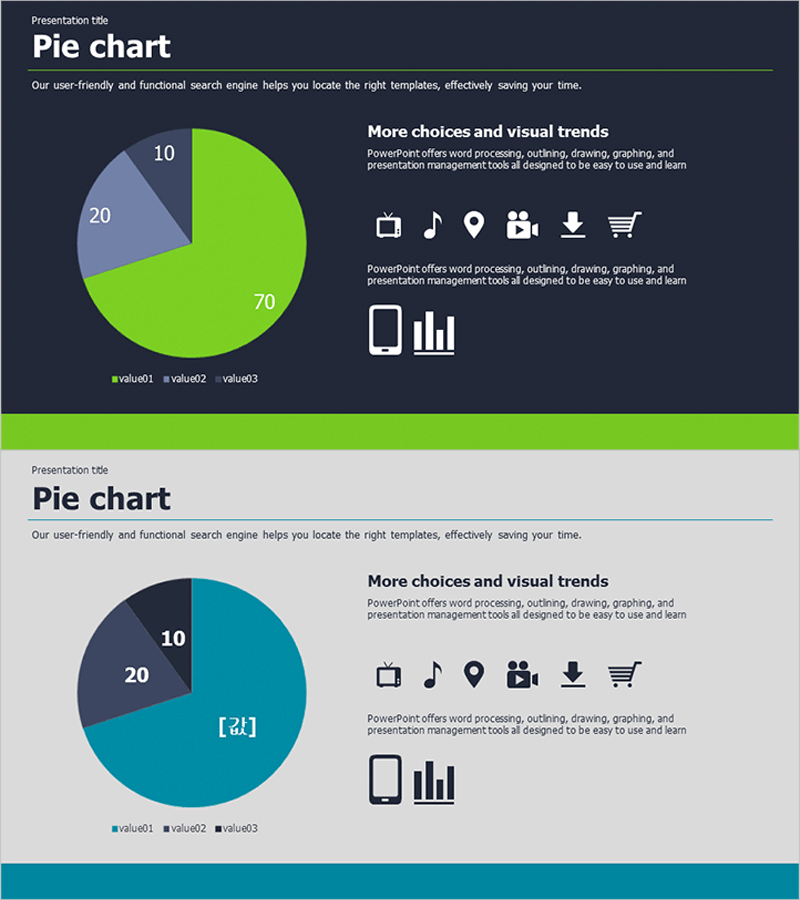
Visualizing Market Share with Pie Chart – Successful Investment Planning
#Market and Competitor Analysis #Financial Plans and Performance #Graph
-
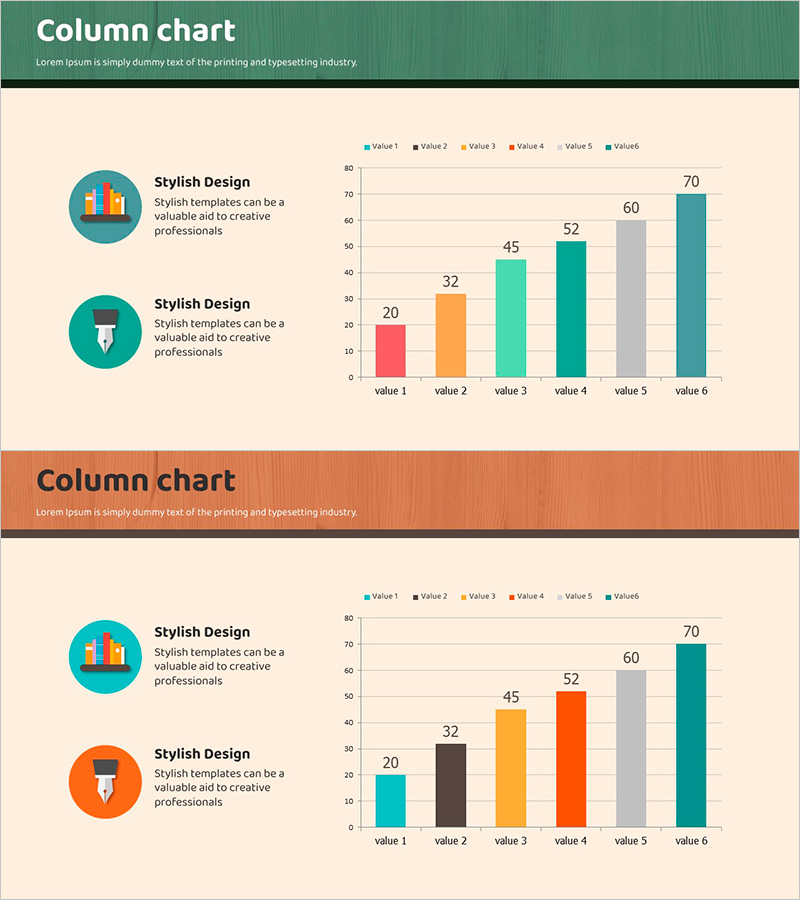
Vertical Bar Standard Color Chart for Market Analysis – Market and Competitor Analysis
#Market and Competitor Analysis #Graph #Competitor Analysis
-
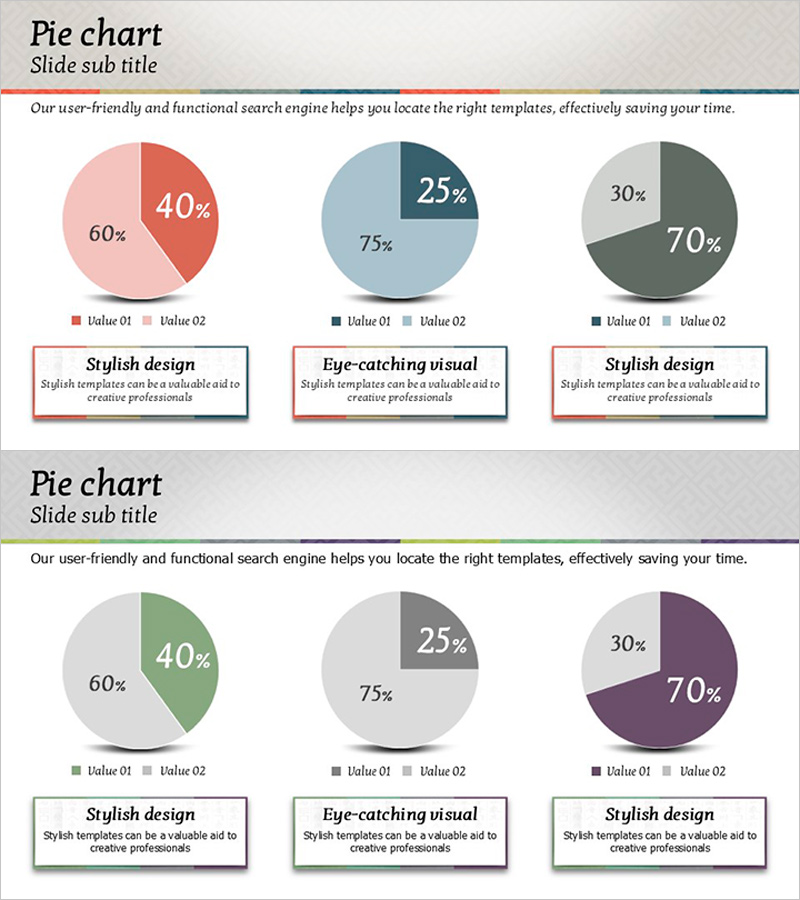
Korean Traditional Template Pie Chart – Stylish and Eye-catching Design
#Graph
-
Energy Saving Market Trend Analysis Slide
#Market and Competitor Analysis #Graph #Other
