Energy Saving Market Trend Analysis Slide
RJ0600050_17
- Last Update 07/04/2025
- File Size 0.2MB
- # of Slides 2
- File Format PPTX
- Slide Ratio 16:9
- Color
Keywords
About the Product
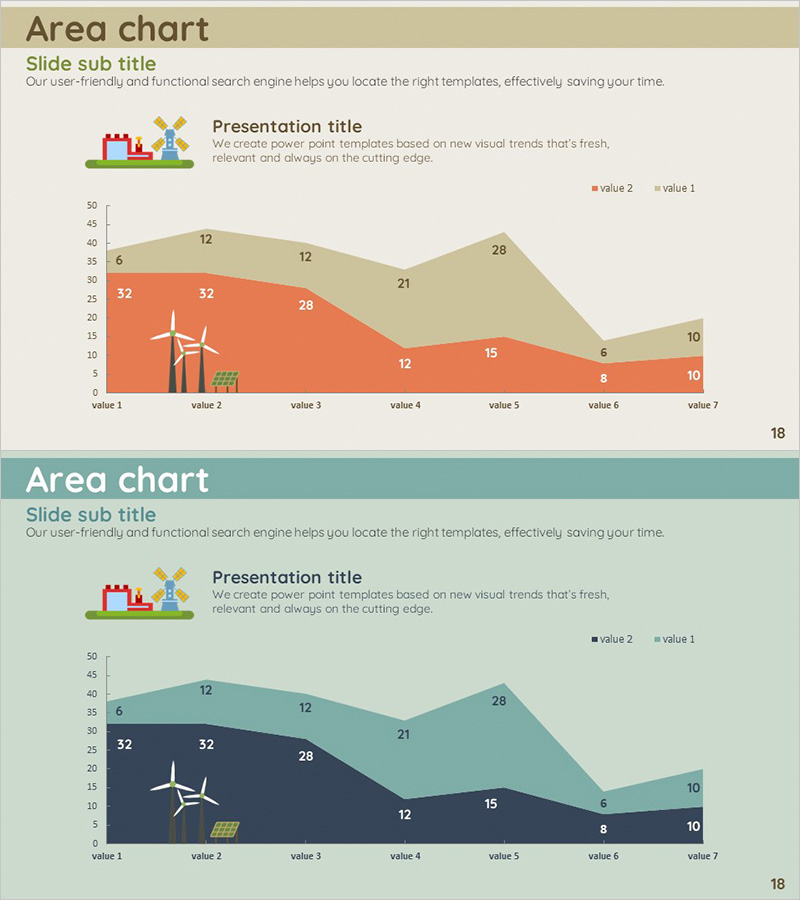
A 2-slide PowerPoint presentation analyzing energy saving market trends through visual data representation. The area chart combines beige, orange, and teal colors to display data progression across 7 intervals, with numerical labels clearly marked on each layer. The slide features a presentation title and descriptive text area at the top, complemented by renewable energy icons on the left side that reinforce the topic context. This slide deck is ready for immediate use in market analysis reports, business presentations, and investor pitch decks.
Usage Points
-
Main Usage
Visualizes energy saving market data progression across time intervals using an area chart, enabling clear communication of market dynamics to stakeholders. Effectively demonstrates market size changes and growth patterns to investors, executives, and business partners.
-
How to Use
Insert this slide into business plans, market analysis reports, or investor presentations within the market overview section. Replace chart values and legend with your own data, then customize the title and descriptive text to match your presentation context.
-
Recommended For
Energy sector professionals, renewable energy specialists, market analysts, business development managers, and investor relations (IR) officers presenting market trends. Suitable for government policy reports, industry analysis documents, and corporate strategy meetings.
-
Slide Structure
The slide comprises a title and description area at the top (1 text box) and a central area chart with 2 data layers (value 1 and value 2). The chart spans 7 X-axis intervals with a Y-axis scale up to 50, featuring numerical labels on each data layer for enhanced readability.
Related Products
-

Core Technologies of AI Chipsets: Performance Characteristics
#Market and Competitor Analysis #Diagram #Graph
-

Day and Night Phase Cumulative Progress – Data Visualization for Business Success
#Business Strategy #Market and Competitor Analysis #Graph
-

Area Chart for Market Trend Analysis – Insights and Growth
#Market and Competitor Analysis #Financial Plans and Performance #Graph
-

Future Outlook Line Graph Blue Orange
#Market and Competitor Analysis #Graph #Other
