Korean Traditional Template Pie Chart – Stylish and Eye-catching Design
RJ0600006_5
- Last Update 06/22/2025
- File Size 1.7MB
- # of Slides 2
- File Format PPTX
- Slide Ratio 16:9
- Color
Keywords
About the Product
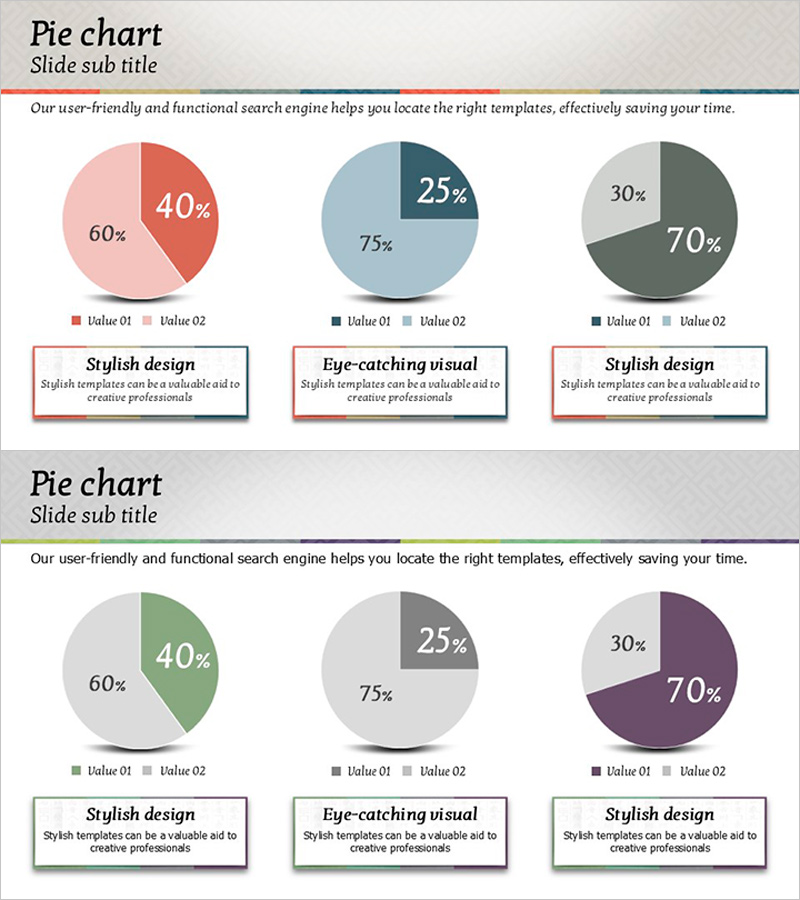
A 2-slide PowerPoint pie chart set designed for clear ratio comparison visualization. Each slide features three pie charts with 2-segment divisions, using distinct color combinations including red, blue, green, and purple to differentiate data categories. Optimized for 16:9 widescreen format in PPTX, this slide deck effectively communicates business metrics such as market share, sales performance, customer satisfaction, and budget allocation. Each pie chart includes a descriptive text box below for additional context, making it ready for immediate use in presentations, reports, and business analysis decks.
Usage Points
-
Main Usage
Ideal for visualizing two-way ratio relationships in marketing analysis, sales performance, customer satisfaction surveys, and market share comparisons. Each pie chart displays varying proportions such as 40%-60%, 25%-75%, or 30%-70%, with color contrast ensuring clear data differentiation.
-
How to Use
Use in business reports, marketing proposals, quarterly performance presentations, and customer analysis materials to explain composition ratios and market positioning. Add analysis text to the text boxes below each chart to enhance presentation persuasiveness and data interpretation.
-
Recommended For
Marketing managers, sales directors, financial analysts, and executives presenting quarterly results, customer segmentation, market analysis, and budget distribution. Suitable for C-level presentations and stakeholder reports.
-
Slide Structure
2-slide set with three pie charts per slide arranged horizontally. Each chart is divided into 2 segments with distinct colors. Descriptive text boxes positioned below each chart. Color schemes vary between slides for visual variety and emphasis.
Related Products
-

Console Game Analysis Bar Graph – Market and Competitive Analysis
#Market and Competitor Analysis #Graph #Competitor Analysis
-

Coffee Cup Pie Chart – Market Share Analysis
#Market and Competitor Analysis #Graph #Market Share
-

Market Share Analysis with Pie Chart – Precise Data Visualization
#Company Introduction #Market and Competitor Analysis #Graph
-

Curved Theme Purple Template Donut Chart – A Stylish Choice for Market Analysis
#Company Introduction #Market and Competitor Analysis #Graph
