Market and Competitor Analysis
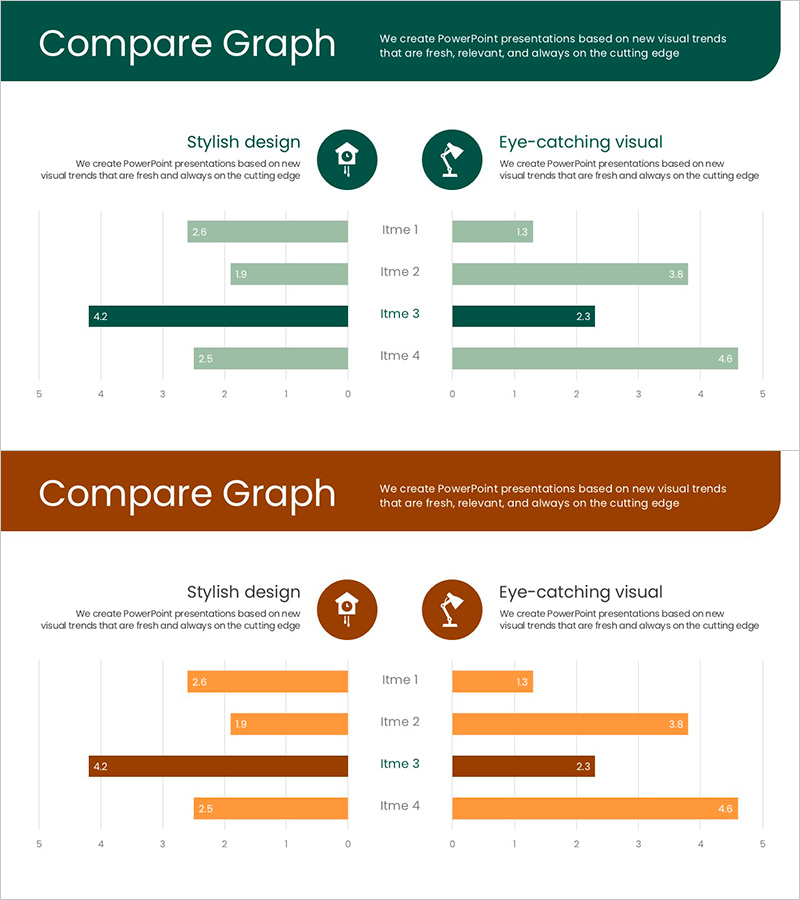
Sales Comparison Graph by Product – Competitive Advantage and Performance Analysis
RJ0900033_9
- Last Update 12/21/2025
- File Size 0.2MB
- # of Slides 2
- File Format PPTX
- Slide Ratio 16:9
- Color
Keywords
- #Content-Based Slides
- #Design-Based Slides
- #Market and Competitor Analysis
- #Financial Plans and Performance
- #Graph
- #Competitive Advantage
- #Sales and Revenue
- #Horizontal Bar
- #Double Horizontal Bar
- #16:9
- #Sales Comparison by Product
- #Horizontal Bar Graph
- #Market Analysis
- #Competitive Advantage
- #Financial Performance
About the Product
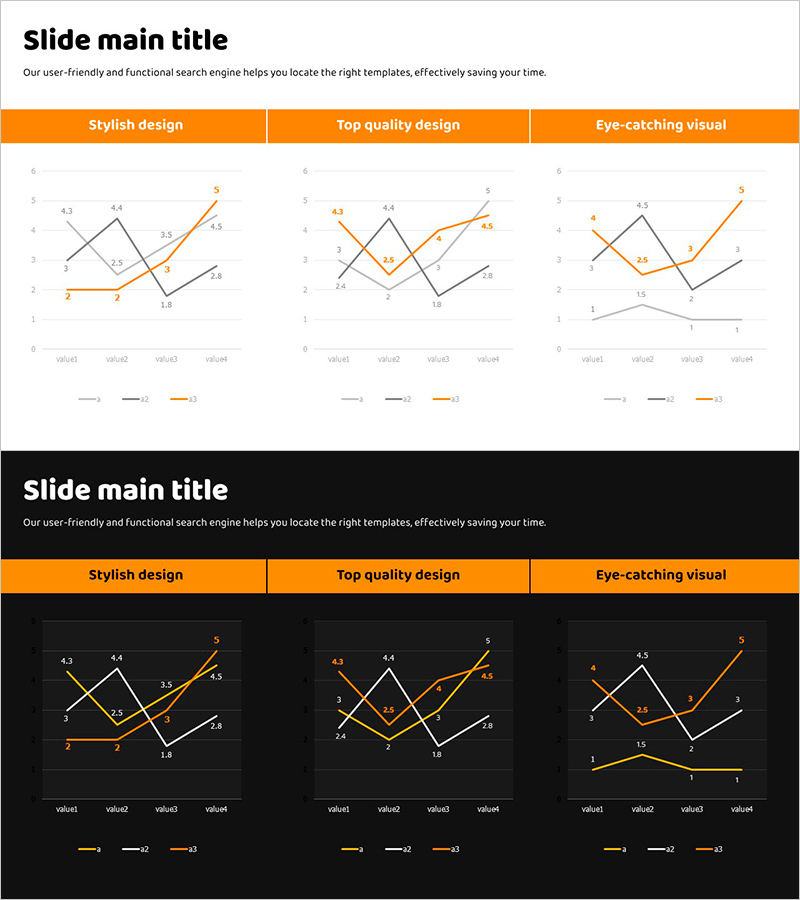
This slide features a horizontal bar graph designed to visually present sales comparisons by product. The graphic elements are structured for clear insights into each product's performance, using a striking combination of orange, brown, and green colors to deliver an engaging visual. This template is optimized for market research, competitor analysis, and financial performance presentations, allowing users to emphasize competitive advantages intuitively through comparison. Text and graph elements are easy to replace, with an editing difficulty rated as 'moderate', making it versatile for various presentations.
Related Products
-
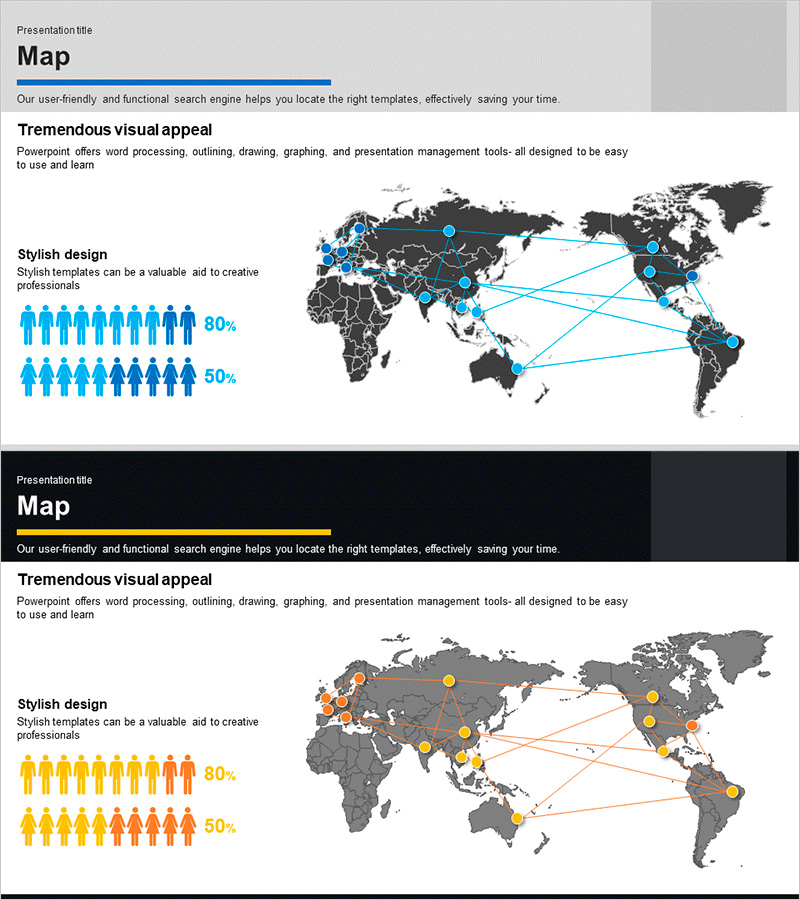
Analysis of Global User Distribution – Data Visualization and Trends
#Company Introduction #Market and Competitor Analysis #Other
-
Market Status Chart Analysis – Data-Driven Insights
#Business Promotion Strategy #Market and Competitor Analysis #Graph
-
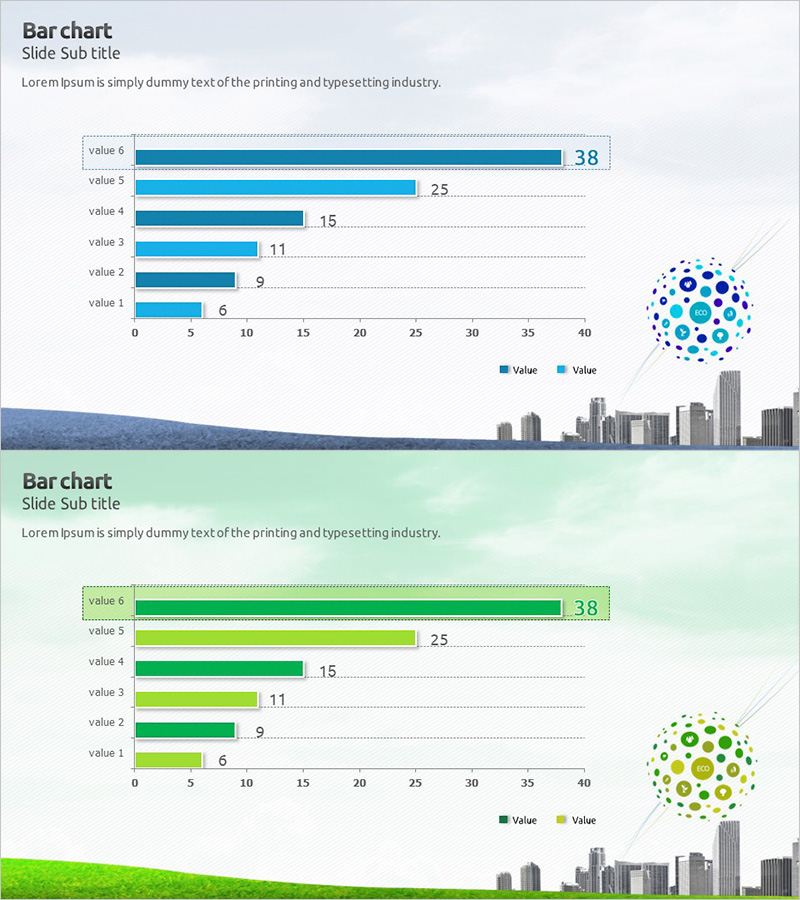
Eco Market Analysis Graph – Visualizing Competitive Advantage Data
#Market and Competitor Analysis #Graph #Market Status
-
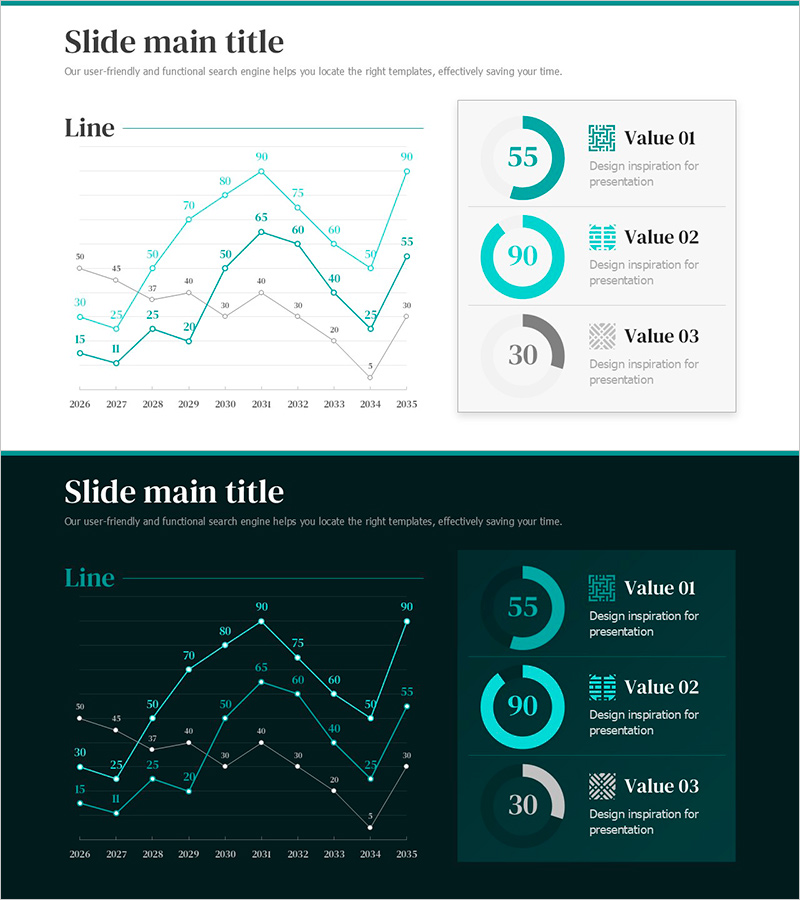
Orange Line Chart Set – Market Trend Analysis
#Market and Competitor Analysis #Graph #Industry Trends
