Analysis of Global User Distribution – Data Visualization and Trends
RJ0300011_19
- Last Update 04/21/2025
- File Size 0.6MB
- # of Slides 2
- File Format PPTX
- Slide Ratio 16:9
- Color
Keywords
- #Content-Based Slides
- #Design-Based Slides
- #Company Introduction
- #Market and Competitor Analysis
- #Other
- #Global Network
- #Customer Analysis
- #Map
- #16:9
- #global user distribution map PowerPoint
- #world map data visualization slide
- #how to create a global network map in PowerPoint
- #user distribution analysis PPT
- #geographic market analysis slide
About the Product
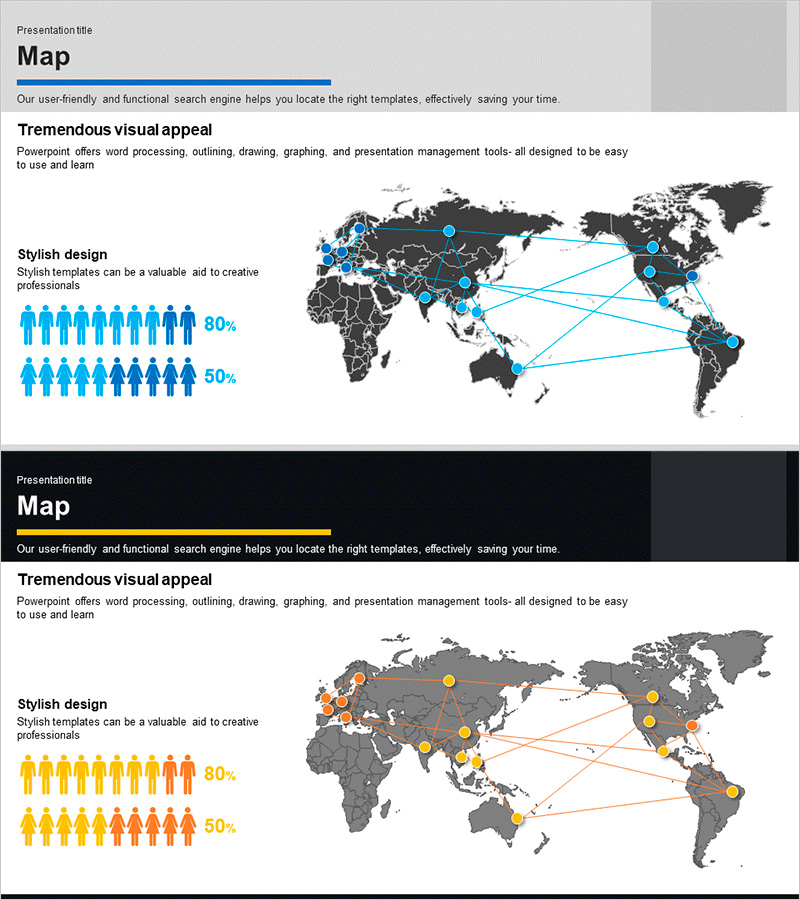
A 2-slide PowerPoint presentation featuring global user distribution visualization with a dark background world map. Blue circular markers and connection lines represent user locations across countries and network flows between regions. The layout includes a title and description area at the top, a central world map with 12 location markers and interconnecting lines, and statistical infographics at the bottom (80%, 50% ratios). Ideal for market analysis, customer distribution reports, and global strategy presentations. Available in 16:9 widescreen PPTX format, fully editable in all PowerPoint versions.
Usage Points
-
Main Usage
Designed to display geographic distribution of users, customers, and partners across global markets at a glance. Blue markers and connection lines on the world map intuitively communicate international business flows, market expansion strategies, and global network structures to stakeholders.
-
How to Use
Use in investor presentations (IR), market analysis reports, global strategy meetings, and customer analysis documents as the user distribution section. Customize marker positions and connection lines to match your actual data, and modify statistical figures (80%, 50%) freely to reflect your metrics.
-
Recommended For
Ideal for executives and management teams developing global business strategies, startups and mid-sized companies planning international market entry, data analysts and consultants requiring customer base analysis, and senior leaders presenting global network expansion to investors and partners.
-
Slide Structure
Each slide features a title and description text area at the top, a central world map visualization with 12 blue location markers and interconnecting lines, and statistical infographics at the bottom with people icons and percentage metrics. Two color versions (blue and orange) are included for flexible brand color matching.
Related Products
-

Global User Analysis Map Graph
#Company Introduction #Market and Competitor Analysis #Graph
-

Orange Blue Map Location Marker – Cornerstone of Global Network
#Company Introduction #Other #Global Network
-

Region Display Donut Graph – Infographic for Market Analysis
#Company Introduction #Market and Competitor Analysis #Other
-

World Map and Learning Content Icon – Visualization of Global Network
#Company Introduction #Other #Global Network
