Financial Plans and Performance
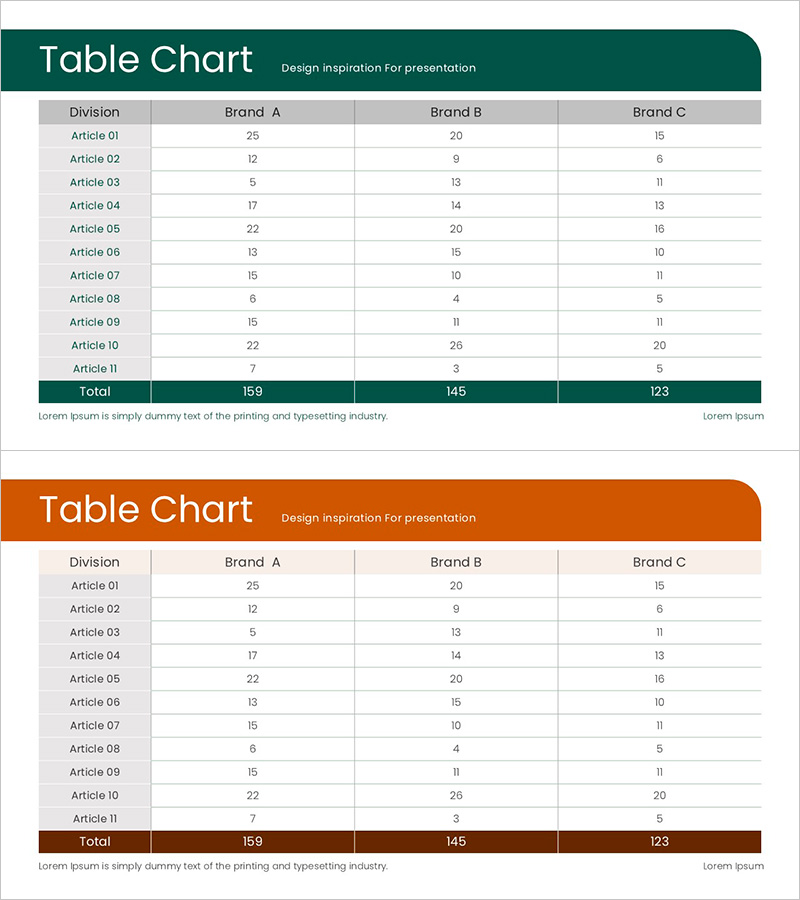
Green Brown Statistics Table – Financial Performance Analysis
RJ0900033_29
- Last Update 12/21/2025
- File Size 0.2MB
- # of Slides 2
- File Format PPTX
- Slide Ratio 16:9
- Color
Keywords
About the Product
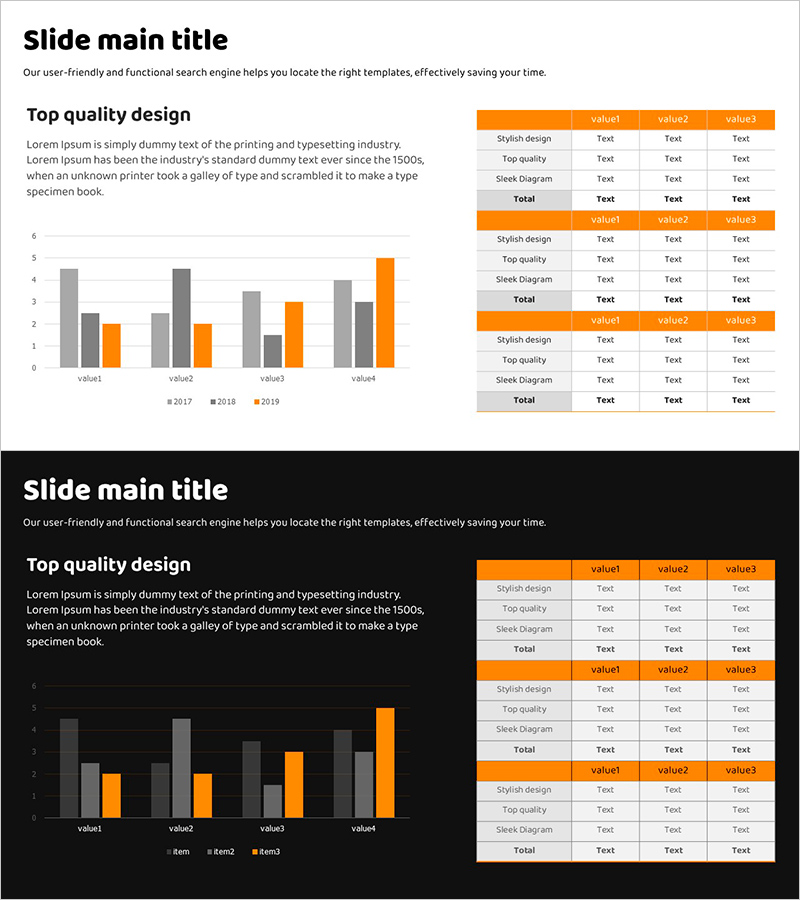
This slide features a stylish statistics table in green and brown hues, clearly depicting various brand performances in numeric format. With a structure suitable for data comparison, it is ideal for quarterly or annual performance analysis and financial status reports. This slide effectively communicates financial planning and performance content, instilling confidence in professionals and investors. Additionally, it has an 'easy' editing level, allowing for quick replacement of text and data.
Related Products
-
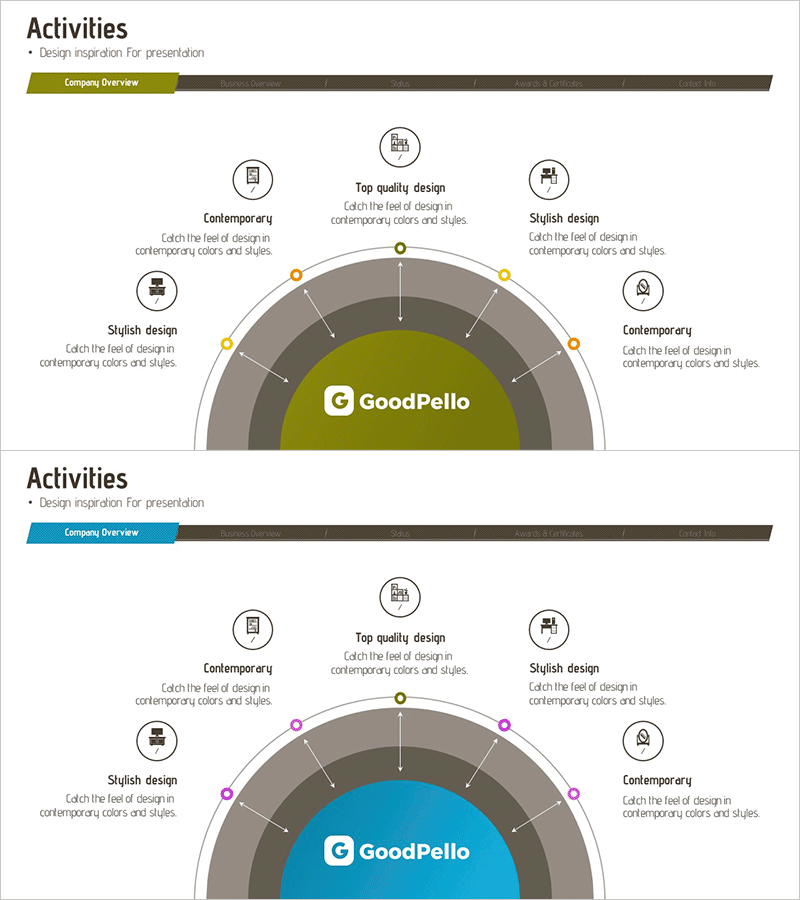
Business Activity Areas Diagram – Strategic Cluster Composition
#Business Introduction #Business Vision and Strategy #Diagram
-
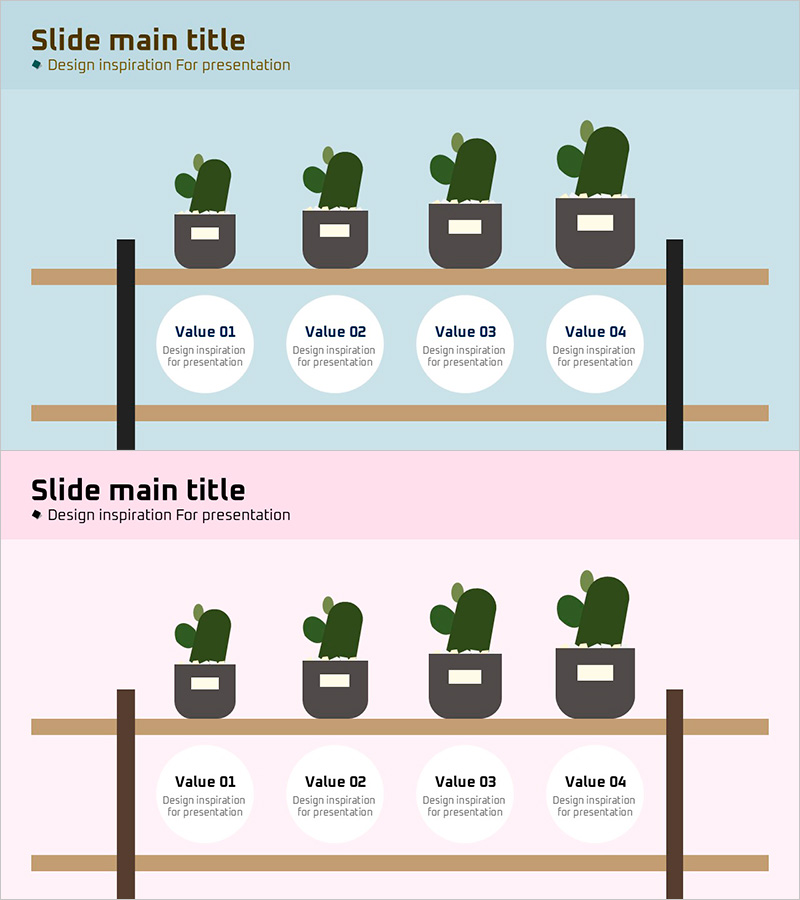
Circular Text Box and Cactus on Shelf Slide
#Product/Service #Operation Plan #Diagram
-
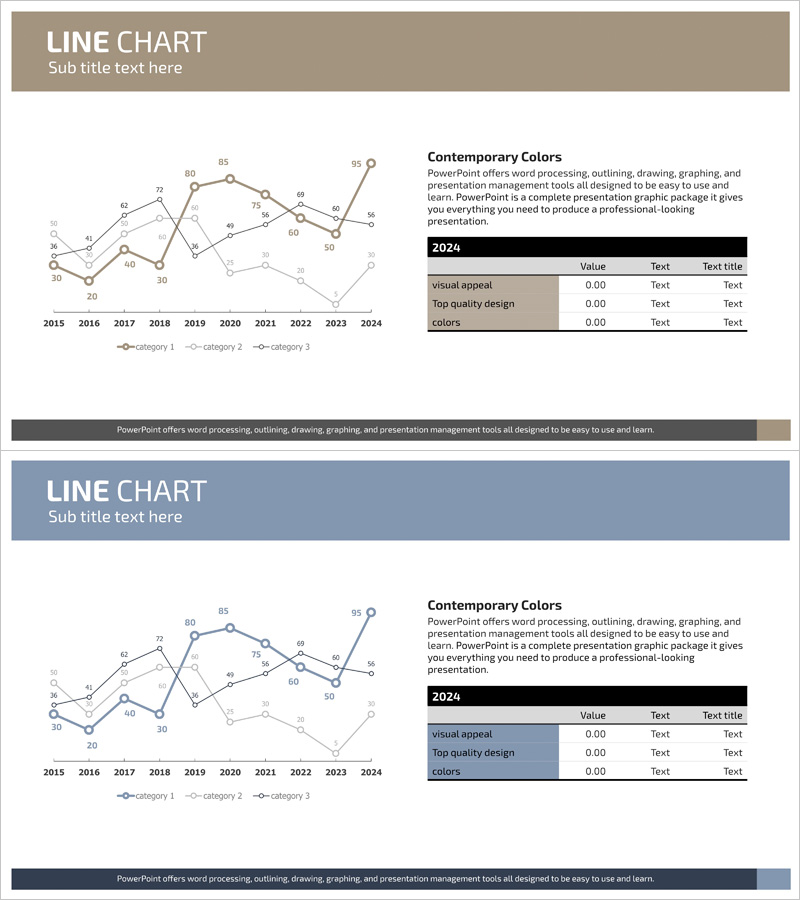
Competitor Analysis Graph & Table by Year
#Market and Competitor Analysis #Diagram #Graph
-
Performance Analysis Table Slide – Market and Competitor Analysis
#Market and Competitor Analysis #Diagram #Graph
