Business Activity Areas Diagram – Strategic Cluster Composition
RM0300014_6
- Last Update 02/10/2025
- File Size 1.2MB
- # of Slides 2
- File Format PPTX
- Slide Ratio 16:9
- Color
Keywords
- #Content-Based Slides
- #Design-Based Slides
- #Business Introduction
- #Business Vision and Strategy
- #Diagram
- #Business Areas
- #Business Strategy
- #Cluster
- #Spread
- #Chain Diagram
- #Radial Diagram
- #16:9
- #radial diagram PowerPoint
- #expansion diagram slide
- #business activity areas presentation
- #cluster structure template
- #6-node diagram
- #strategic analysis PowerPoint slide
- #how to create radial diagram in PowerPoint
About the Product
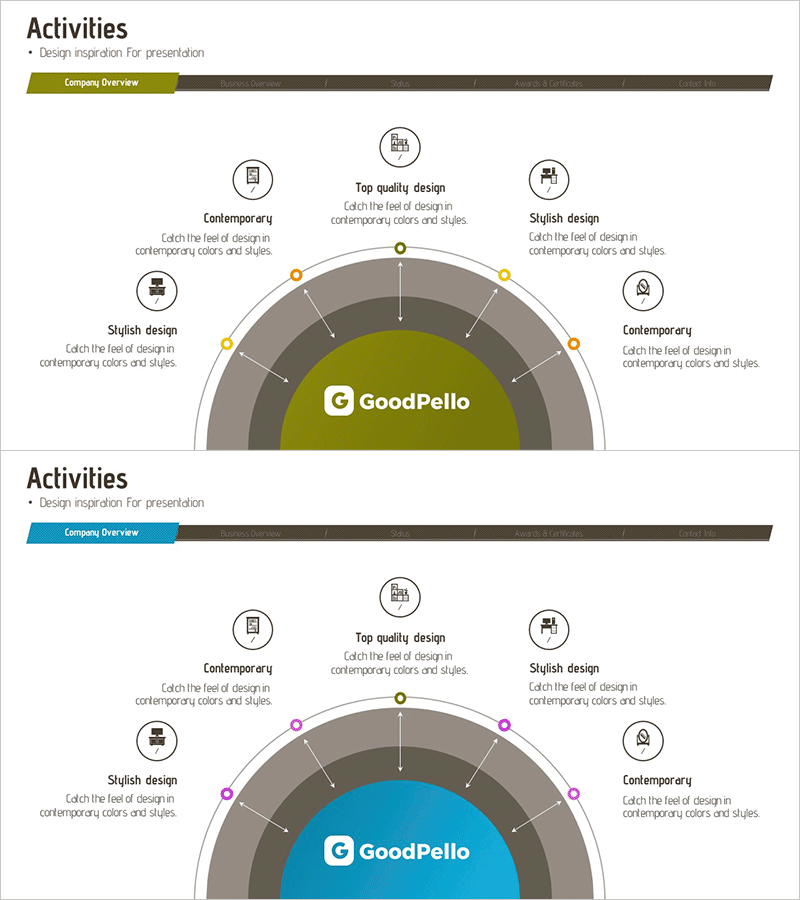
A radial expansion diagram PowerPoint slide with six nodes radiating from a central hub, using olive green and orange accent points. This design effectively visualizes business activity areas, strategic divisions, organizational roles, and hierarchical relationships. The 2-slide set includes a completed diagram example and an editable blank template for immediate data input. Delivered in 16:9 widescreen PPTX format, fully compatible with all PowerPoint versions for seamless editing and presentation.
Usage Points
-
Main Usage
Visualizes organizational core functions and business activities by radiating from a central concept outward. Effectively communicates strategic frameworks, business domain analysis, organizational structures, role distribution, and hierarchical information relationships across diverse business contexts.
-
How to Use
Apply in company overview presentations for business area sections, strategic planning presentations, organizational restructuring explanations, and marketing strategy documents for target analysis. Insert core concepts in the center node and detailed items in the six surrounding nodes to provide comprehensive structural overview at a glance.
-
Recommended For
Executives, strategic planning teams, marketing departments, organizational development specialists, management consultants, and business development professionals presenting strategy, business analysis, and organizational structure. Particularly effective for executive-level reports requiring clear multi-layered information presentation.
-
Slide Structure
Central olive green circular node surrounded by six evenly distributed orange accent nodes. Each node includes text input areas with connecting lines from center to peripheral nodes indicating hierarchical relationships. Gray-toned concentric circular background layers add depth and visual hierarchy to the composition.
Related Products
-

Mobile App Service Business Area Slide – Innovation and Vision
#Business Introduction #Business Vision and Strategy #Diagram
-

Global Transportation Network Structure – Cluster Diagram
#Company Introduction #Business Introduction #Diagram
-

Business Sector Structure Hexagon Diagram – Visual Trend Introduction
#Company Introduction #Business Introduction #Diagram
-

Market Segmentation Diagram by Industry
#Business Introduction #Market and Competitor Analysis #Diagram
