Financial Plans and Performance
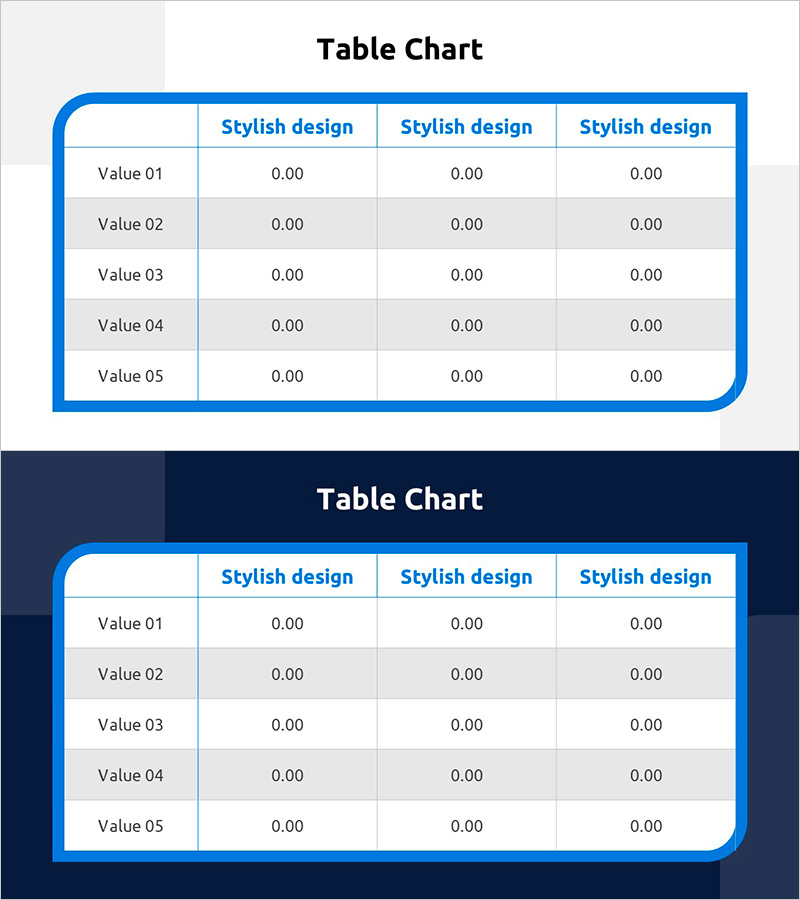
Table Chart of Point Frames – Profit and Loss Statement and Key Financial Metrics
RJ0900030_28
- Last Update 12/21/2025
- File Size 0.3MB
- # of Slides 2
- File Format PPTX
- Slide Ratio 16:9
- Color
Keywords
About the Product
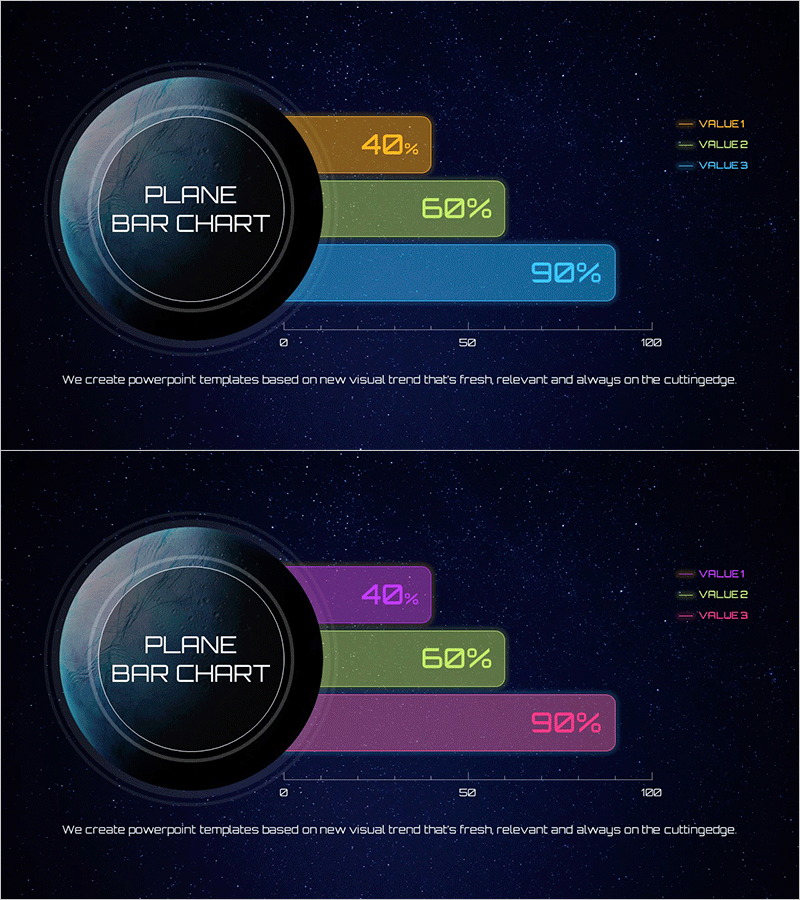
This slide features a stylish table chart of point frames designed to visually emphasize financial performance. Offered in two button-style table options, it exhibits a professional and sleek appearance with a clear blue and navy color combination. This slide is perfect for presenting various financial metrics related to profit and loss statements, making it suitable for corporate reports or meeting materials. Easily replaceable data points with an overall ease of editing rated as 'easy'.
Related Products
-
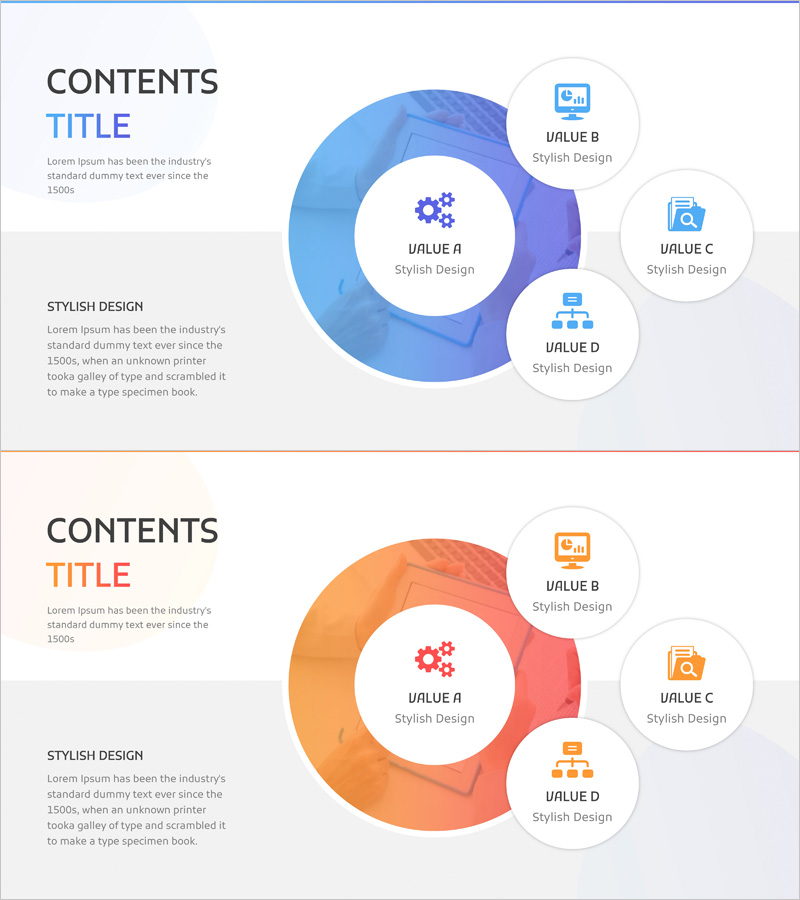
Data Analysis Core Competencies Slide – Visualizing Business Strategy
#Business Vision and Strategy #Diagram #Business Vision
-
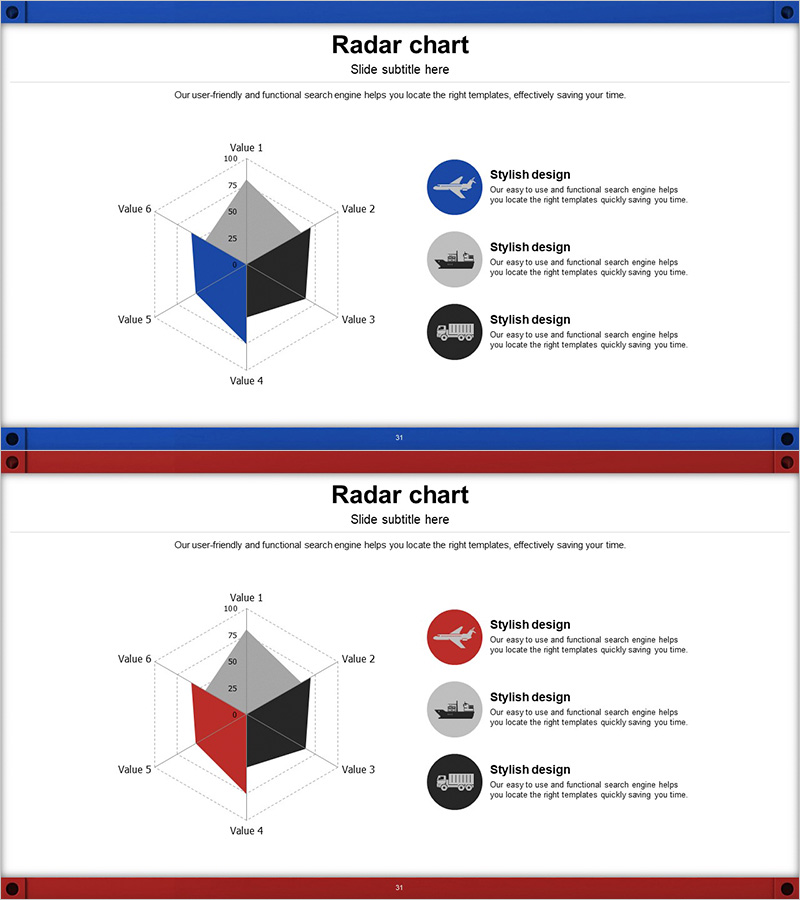
3-Axis Radar Chart Analysis – Effective Data Visualization
#Product/Service #Marketing Plan and Strategy #Diagram
-
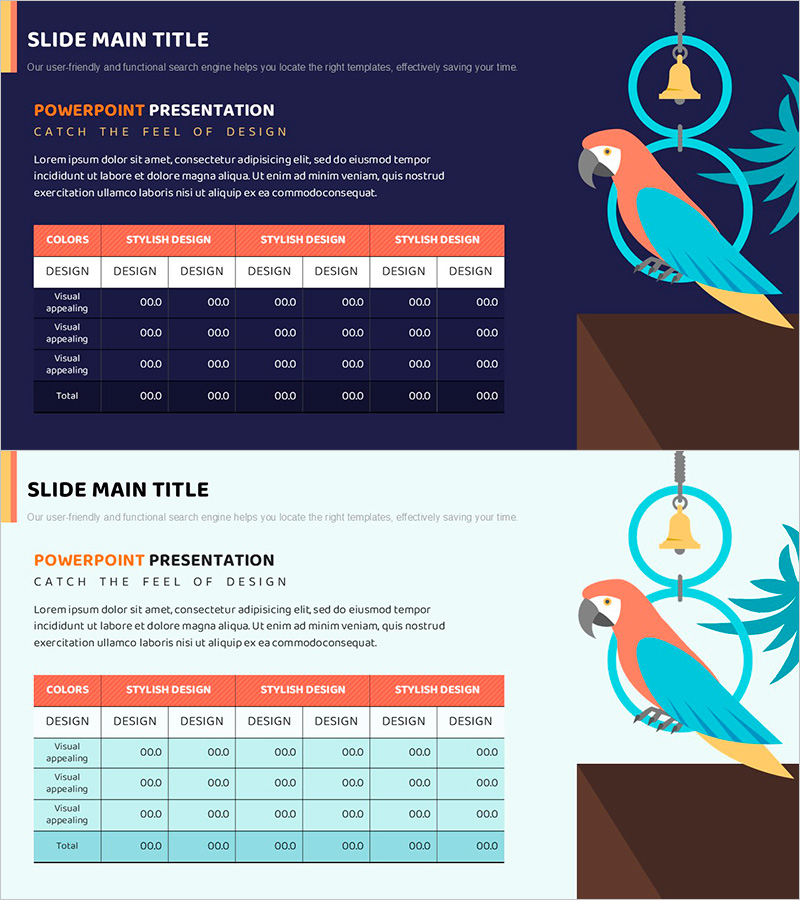
Visualizing Financial Performance with a Pet Parrot Table Slide
#Financial Plans and Performance #Diagram #Balance Sheet
-
Vertical Bar Chart for Performance Visualization – Trust and Innovation
#Product/Service #Market and Competitor Analysis #Diagram
