Market and Competitor Analysis
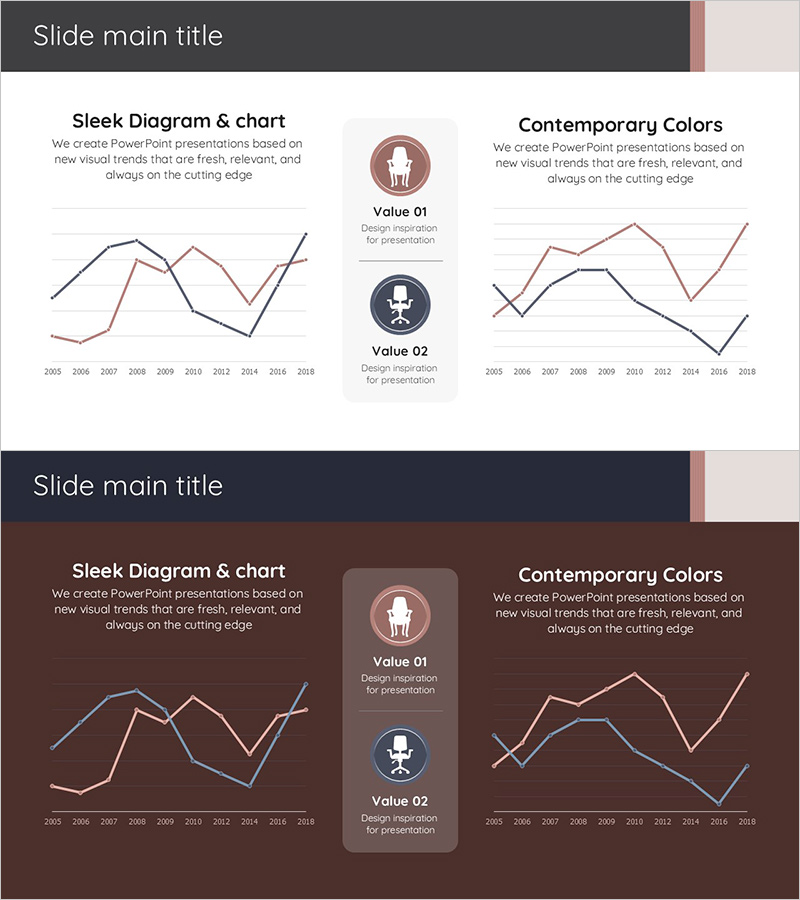
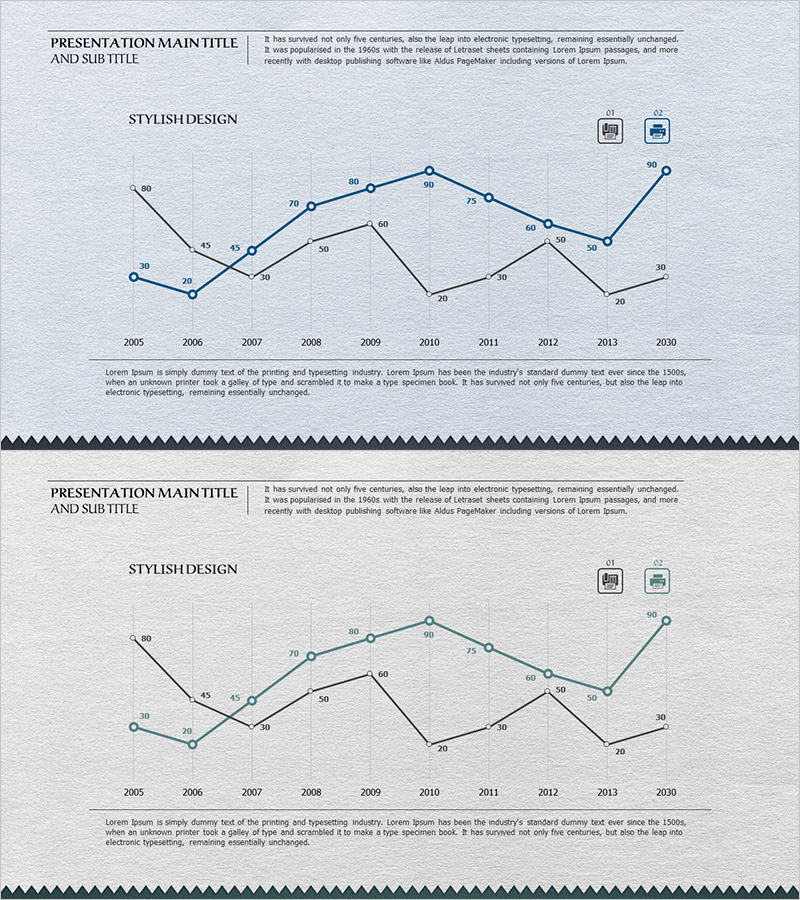
Chair Sales Graph – Visual Data Analysis
RJ0900027_11
- Last Update 12/21/2025
- File Size 0.3MB
- # of Slides 2
- File Format PPTX
- Slide Ratio 16:9
- Color
Keywords
About the Product
This slide presents a graph based on chair sales data, visually analyzing sales trends from 2005 to 2018. The design utilizes a stable brown and navy color palette to convey reliability while featuring clean and modern graphic elements. It is suitable for market and competitor analysis as well as financial planning, providing insights into the evolving market environment. Text and data fields are easy to replace, with an average editing difficulty level. This graph slide efficiently communicates intuitive information about sales and revenue, making it perfect for practitioners' immediate use.
Related Products
-
Donut Chart Slide Visualizing Crime Frequency by Region
#Market and Competitor Analysis #Graph #Other
-
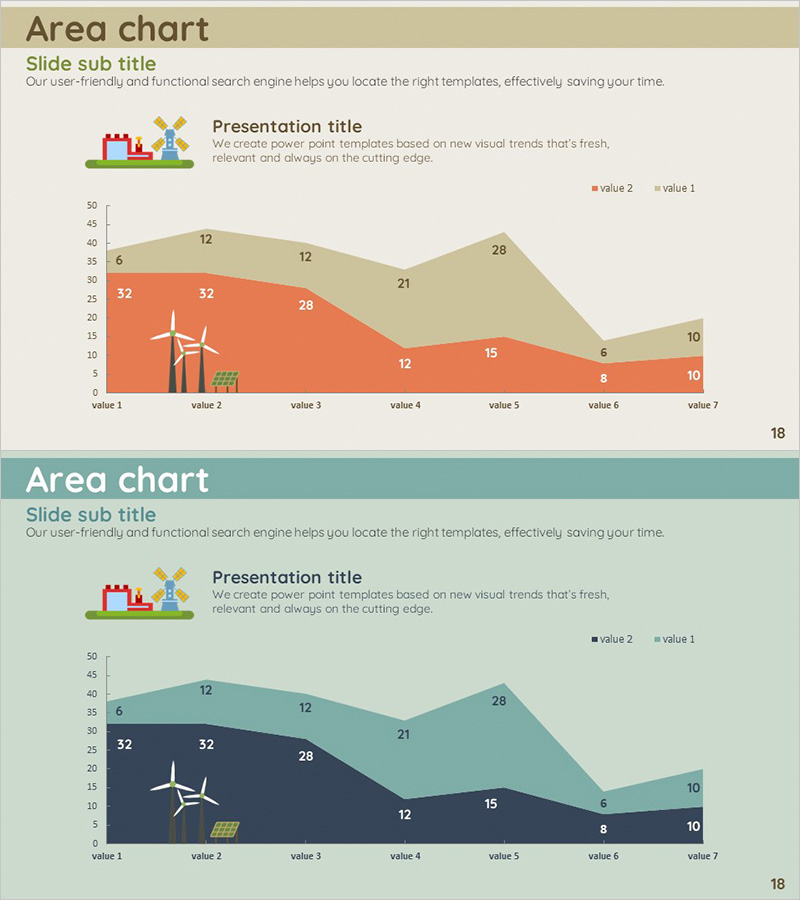
Energy Saving Market Trend Analysis Slide
#Market and Competitor Analysis #Graph #Other
-
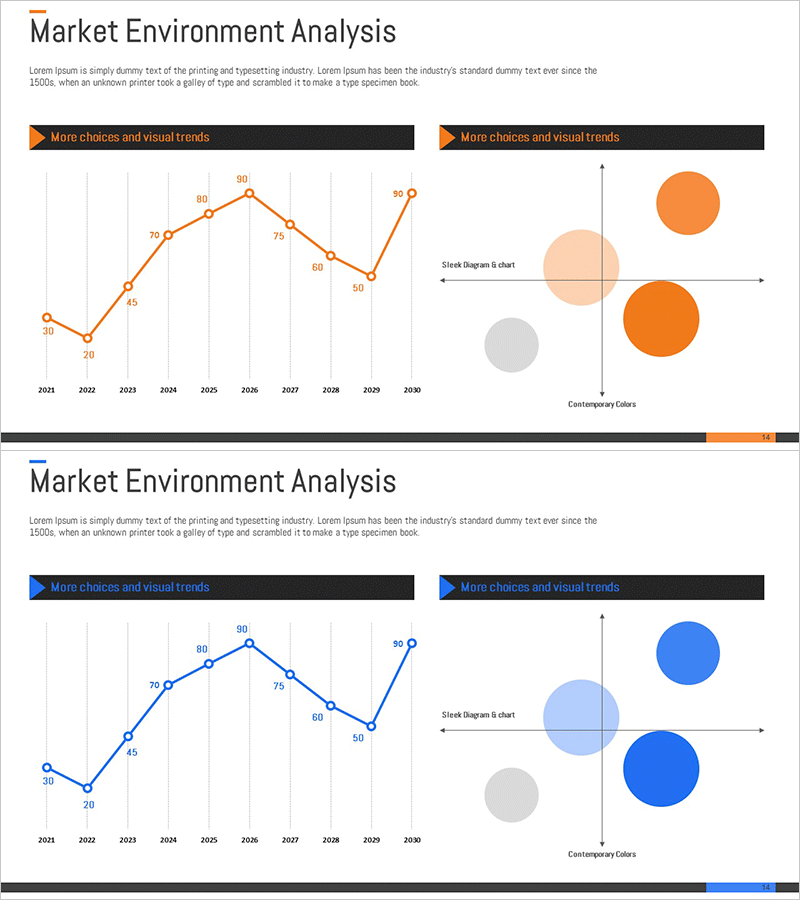
Market Status Analysis & Dot Positioning Map – Understanding Market and Competitors
#Market and Competitor Analysis #Marketing Plan and Strategy #Graph
-
Competitor Comparison Analysis Graph - Optimized for Market and Competitor Analysis
#Market and Competitor Analysis #Graph #Competitor Analysis
