
Market and Competitor Analysis
Market Share Analysis with Blue Purple Donut Graph
RJ0900024_5
- Last Update 12/21/2025
- File Size 0.5MB
- # of Slides 2
- File Format PPTX
- Slide Ratio 16:9
- Color
Keywords
About the Product
This slide features a blue and purple donut graph designed to visually express market share. The contemporary color harmony creates an impressive presentation of data for the audience. Donut graphs are particularly effective for comparative analysis of relative proportions, enabling a quick understanding of the company's market status. The target users include business professionals, marketing teams, and researchers, making it versatile for client meetings or business strategy presentations. With easy text and data modification, the overall editing difficulty is rated as 'easy', allowing for quick application in various presentations.
Related Products
-
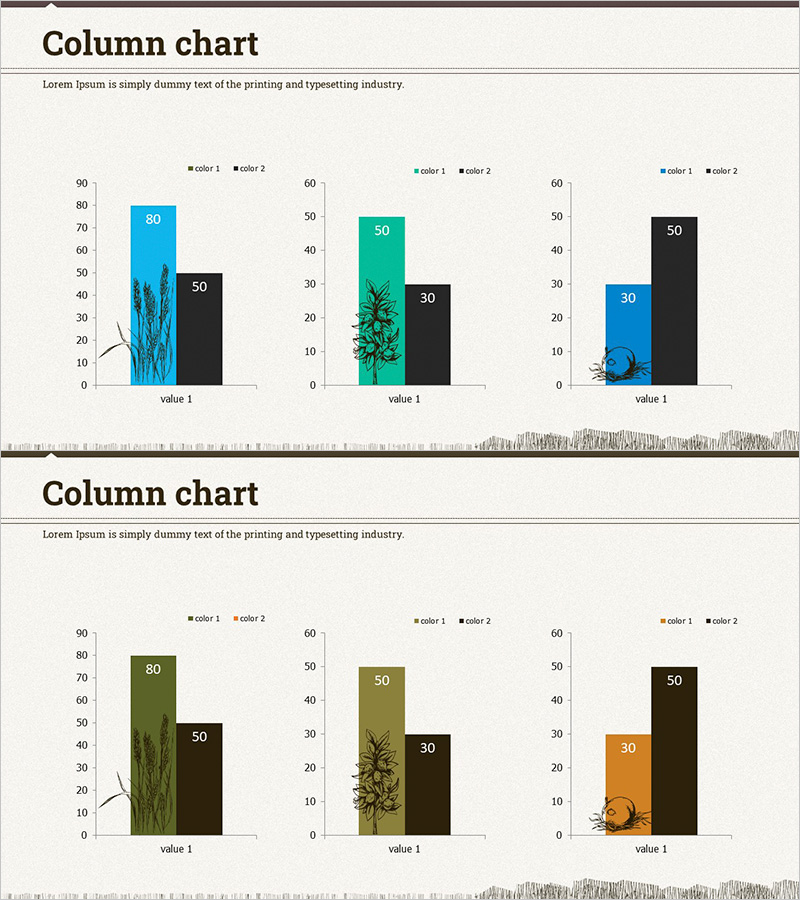
Competitiveness Analysis in Agriculture - Vertical Bar Chart
#Market and Competitor Analysis #Graph #Competitor Analysis
-
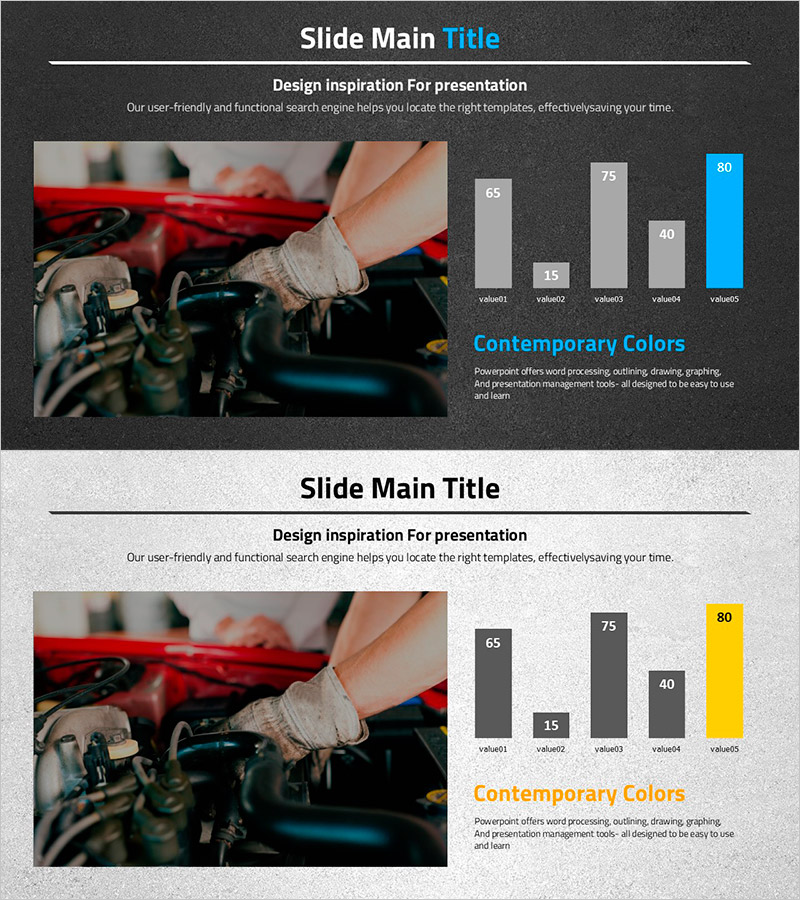
Car Wide Template Vertical Bar Graph – Market Analysis and Competitive Advantage
#Market and Competitor Analysis #Financial Plans and Performance #Graph
-
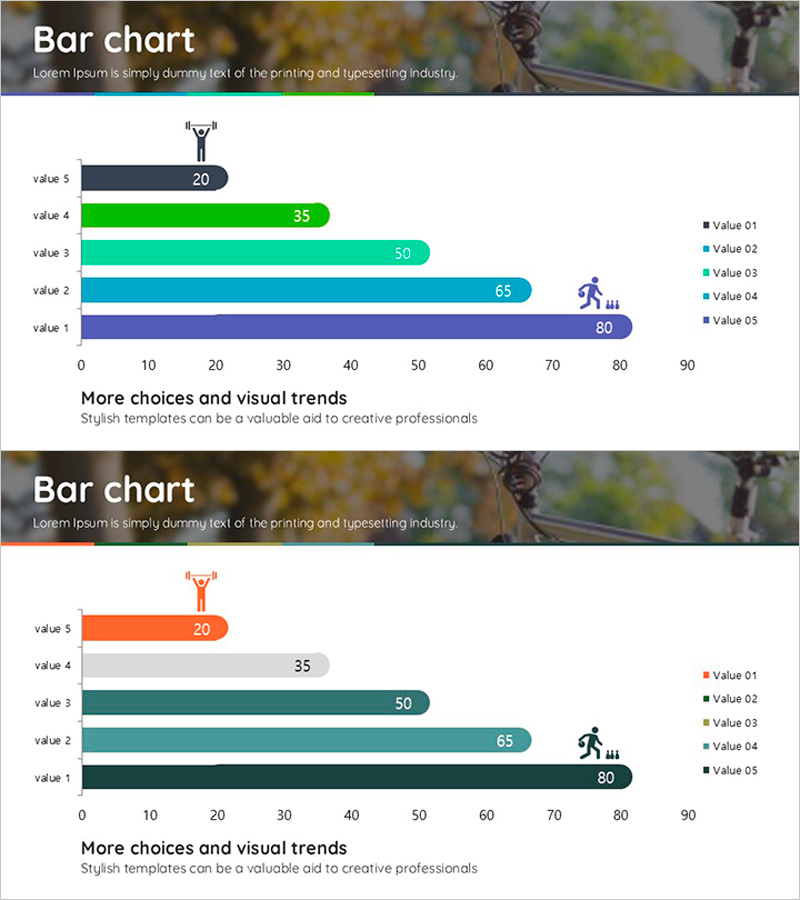
Sports Analysis Bar Chart – Easy Performance Monitoring Option
#Business Promotion Strategy #Market and Competitor Analysis #Graph
-
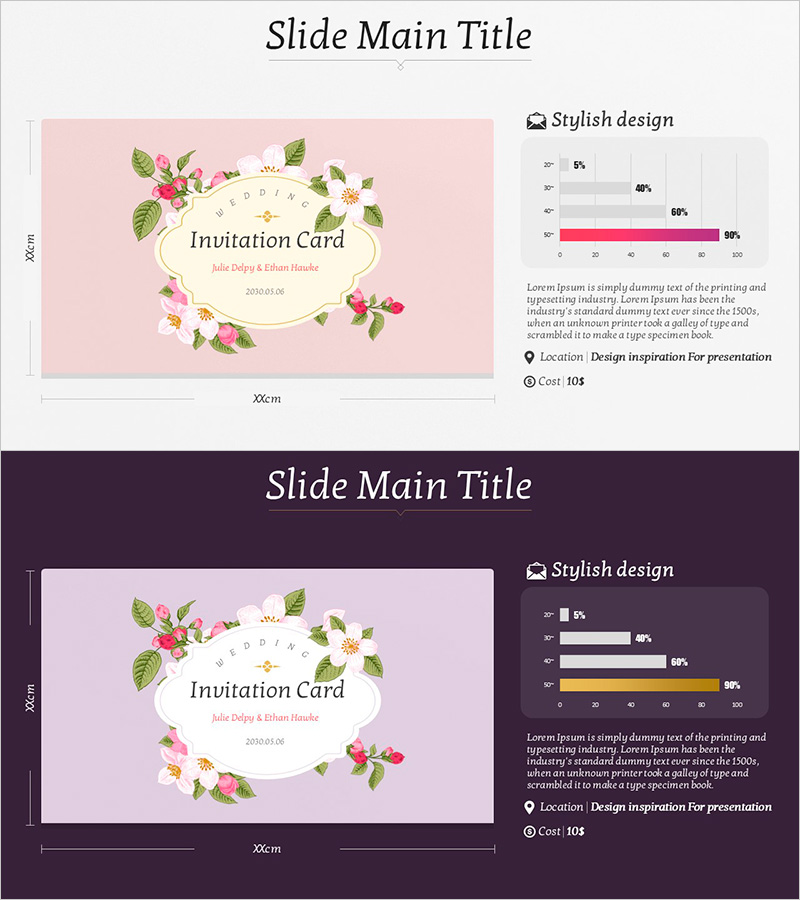
A Survey of Wedding Invitation Design Preferences – Market Analysis Slide
#Market and Competitor Analysis #Graph #Market Analysis
