A Survey of Wedding Invitation Design Preferences – Market Analysis Slide
RJ0800009_22
- Last Update 08/02/2025
- File Size 2.1MB
- # of Slides 2
- File Format PPTX
- Slide Ratio 16:9
- Color
Keywords
- #Content-Based Slides
- #Design-Based Slides
- #Market and Competitor Analysis
- #Graph
- #Market Analysis
- #Horizontal Bar
- #Horizontal Bar Chart
- #16:9
- #horizontal bar chart PowerPoint
- #survey data visualization slide
- #market analysis presentation template
- #design preference chart
- #consumer research PowerPoint slide
About the Product
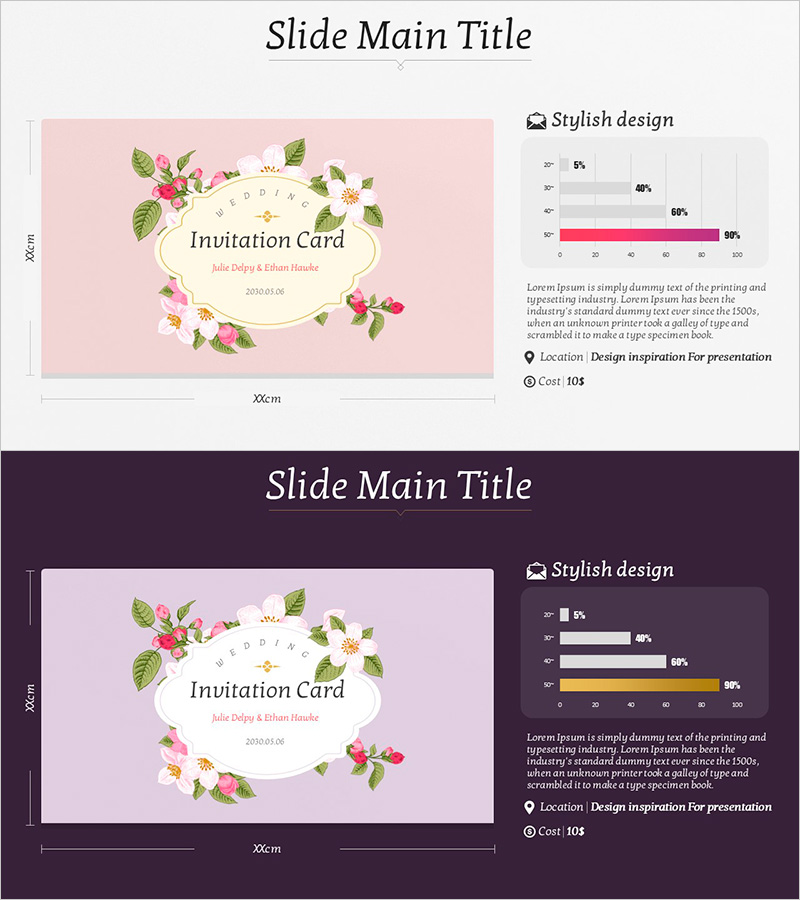
A horizontal bar chart PowerPoint slide visualizing wedding invitation design preferences across four categories. This presentation template features a pink floral aesthetic with elegant typography, perfect for market analysis and consumer research presentations. The 2-slide deck in 16:9 format offers both light and dark background options for flexible presentation environments. Each bar chart displays percentage data ranging from 5% to 90%, enabling clear comparison of design preferences. Ideal for design agencies, wedding industry professionals, and market researchers presenting consumer survey results, trend analysis, and product development insights.
Usage Points
-
Main Usage
Presents consumer preference survey data using a 4-item horizontal bar chart to compare design choices across categories. The percentage-based visualization makes statistical comparisons immediately clear for wedding industry stakeholders, design professionals, and market analysts presenting research findings.
-
How to Use
Each bar element is fully editable—simply replace the percentage values and category labels with your survey data. Choose between the light pink background slide or dark purple background slide depending on your presentation environment and branding requirements. The color palette (pink, beige, gold) remains consistent across both versions for cohesive visual identity.
-
Recommended For
Wedding industry marketing teams, design agencies, consumer research specialists, product managers, business analysts. Suitable for wedding product development presentations, consumer preference analysis reports, marketing strategy meetings, design trend seminars, and market research conferences.
-
Slide Structure
Slide 1: Light pink background with 4-item horizontal bar chart (5%–90% range), floral illustration accents, category labels, and percentage values. Slide 2: Dark purple background with identical 4-item bar chart structure, white text, pink accent colors. Both slides include legend and data labels for clarity.
Related Products
-

Competitor and Market Analysis Slide – Pink & Bluegreen PowerPoint Template
#Market and Competitor Analysis #Graph #Competitor Analysis
-

Fire Dispatch Graph – Market Analysis and Competitive Advantage
#Market and Competitor Analysis #Graph #Market Analysis
-

Bar Chart for Class Evaluation Results – Visual Appeal and Eye-Catching
#Market and Competitor Analysis #Graph #Market Status
-

Market Analysis Horizontal Bar Chart – Competitor Analysis
#Market and Competitor Analysis #Graph #Market Analysis
