Market and Competitor Analysis
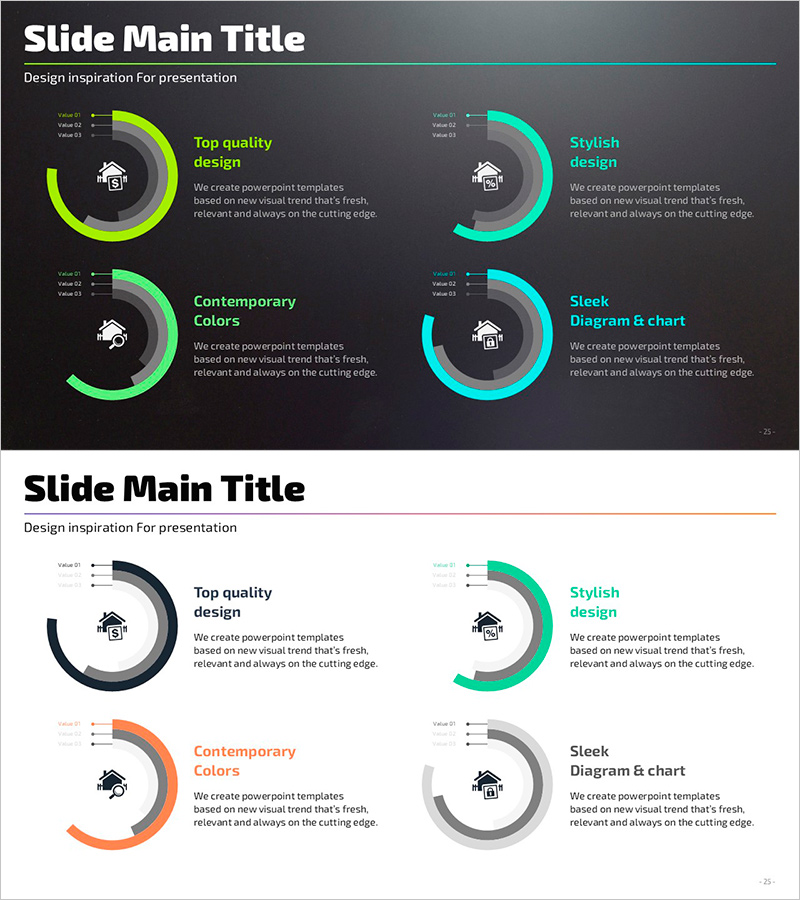
Real Estate Performance Status Donut Graph – Essential for Market Analysis
RJ0900020_24
- Last Update 12/21/2025
- File Size 6.2MB
- # of Slides 2
- File Format PPTX
- Slide Ratio 16:9
- Color
Keywords
About the Product
This slide effectively visualizes real estate performance status using a donut graph. It features a sleek and modern design with a harmonious color combination of green, turquoise, and orange, conveying trust and positivity to users. The donut design allows for easy comparison of various data proportions, making it suitable for real estate market analysis, performance reviews, and strategy formulation. It can be widely utilized in various business contexts such as internal reports, executive meetings, and investor briefings. The editing difficulty is rated as easy, allowing for quick integration with straightforward text and data replacements.
Related Products
-
Visualize Market and Customer Analysis with Vertical Bar Cluster Graph
#Market and Competitor Analysis #Graph #Customer Analysis
-
Competitor Market Trend Analysis Graph – Essential Tool for Market Understanding
#Market and Competitor Analysis #Graph #Market Analysis
-
Construction Business Trend Graph of Office Buildings – Essential Template for Market Analysis
#Market and Competitor Analysis #Graph #Market Share
-
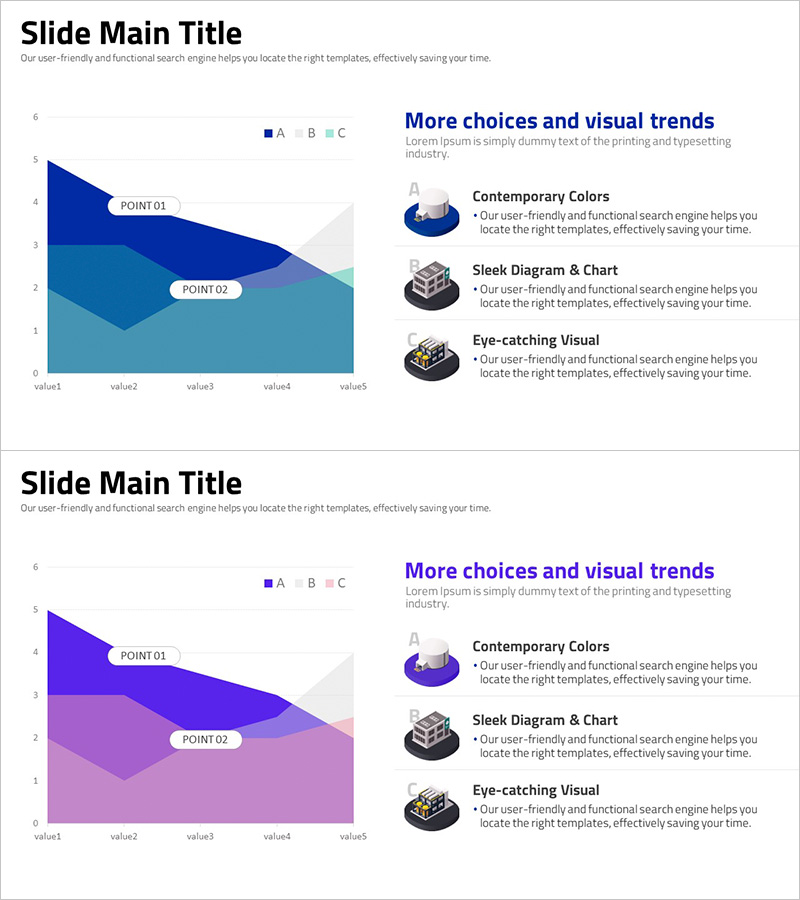
Vertical Area Chart for Data Analysis Visualization – Contemporary Colors and Attractive Design
#Business Vision and Strategy #Marketing Plan and Strategy #Graph
