
Company Introduction
Project Key Performance Charts – Highlighting Core Achievements
RJ0900018_5
- Last Update 12/21/2025
- File Size 4.2MB
- # of Slides 2
- File Format PPTX
- Slide Ratio 16:9
- Color
Keywords
About the Product
This slide visually represents the key achievements of the project using a donut chart. The harmonious blend of orange and purple delivers a vibrant and modern feel, helping users easily grasp the relevant data. Ideal for company overviews or performance introduction materials, it is effective for business presentations and progress reports. Text and data replacements are easy, with an editing difficulty rated as 'easy' for quick modifications.
Related Products
-

Infographic Slide Visualizing Company Account Location
#Company Introduction #Contact Information
-
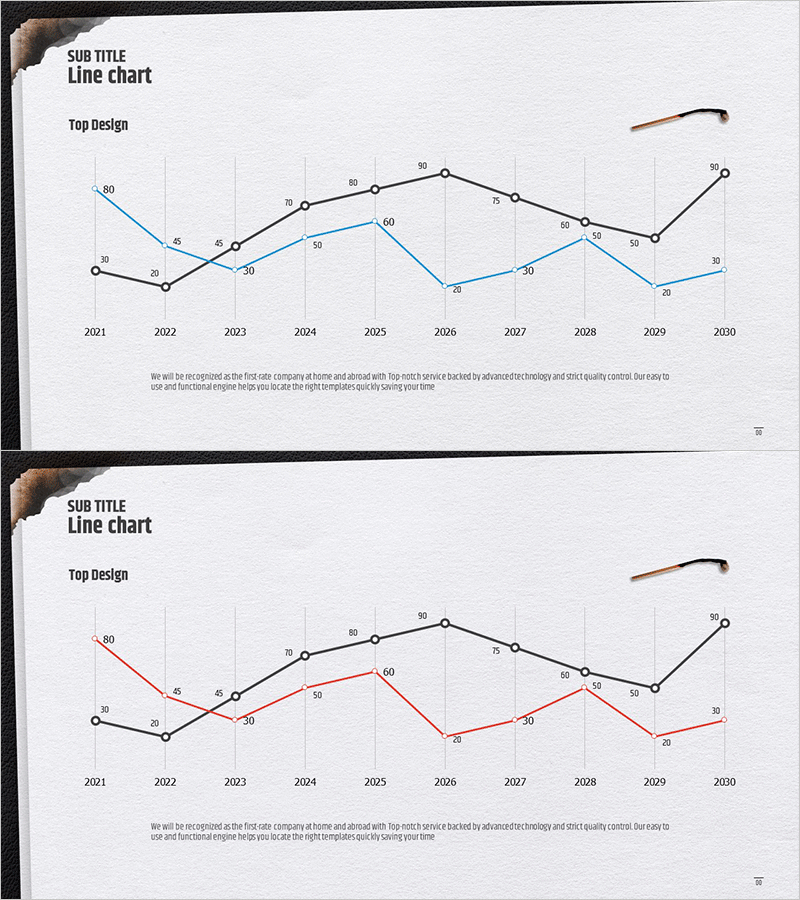
Burnt Paper Theme Broken Line Graph – Market and Competitor Analysis
#Market and Competitor Analysis #Graph #Competitor Analysis
-

Gradient PowerPoint Template for Horizontal Bar Segmentation Graph
#Business Introduction #Financial Plans and Performance #Graph
-
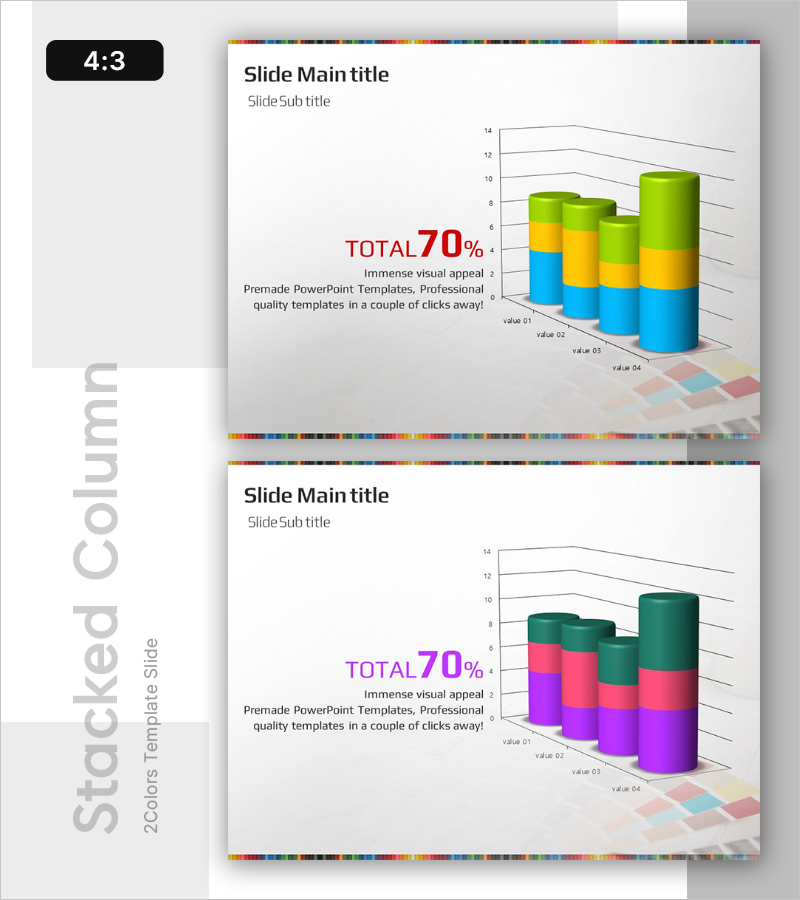
3D Segmented Bar Graph for Performance Analysis – Market Trends
#Market and Competitor Analysis #Graph #Customer Analysis
