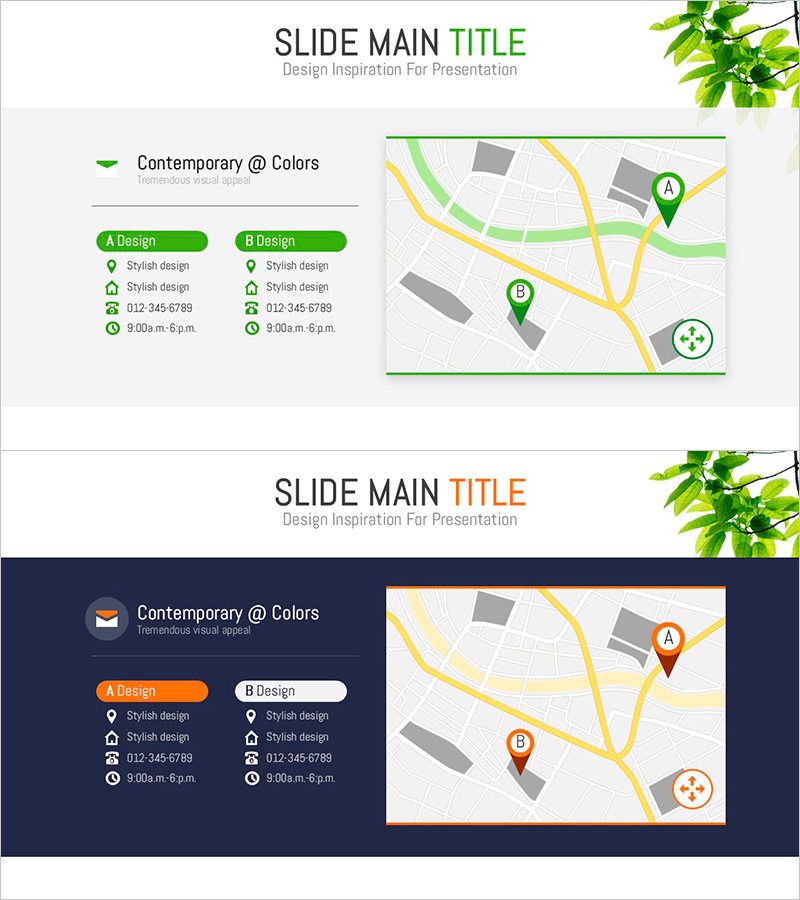
Infographic Slide Visualizing Company Account Location
RJ0800008_29
- Last Update 08/02/2025
- File Size 0.7MB
- # of Slides 2
- File Format PPTX
- Slide Ratio 16:9
- Color
Keywords
About the Product
A PowerPoint slide that visualizes your company's account locations and partner offices on an interactive map-based infographic. Available in two color themes—green and orange—with a side-by-side comparison layout: text information on the left (A Design and B Design options) and map visualization on the right. Each account location displays a pin marker, contact details, and operating hours using icons for quick reference. This slide is ideal for company presentations, business proposals, investor pitches, and partnership overviews where you need to communicate your geographic footprint and business network at a glance.
Usage Points
-
Main Usage
Effectively communicate your company's geographic reach, key accounts, and partner network by displaying locations on an interactive map. This slide helps investors, clients, and partners understand your business scope and market presence across regions or globally.
-
How to Use
Enter account names, contact information, and operating hours in the left text boxes. Choose between A Design (green) or B Design (orange) to match your brand colors. Place location pins on the map and customize icons as needed. Perfect for the 'Global Network' or 'Partner Network' section of company presentations.
-
Recommended For
Company profiles, business proposals, investor presentations, partnership announcements, regional business reports, and expansion strategy decks. Especially useful for multinational corporations, logistics, real estate, franchise operations, and organizations emphasizing geographic presence.
-
Slide Structure
Two-slide set with each slide featuring a left panel containing two text boxes (A Design and B Design options) and a right panel with map visualization. Text areas accommodate 4–5 data points per account (name, address, phone, hours, etc.), with location pins and icons creating information hierarchy on the map.
Related Products
-

Introduction Page – A Brief About Myself
#Company Introduction #Introduction of Executives #Contact Information
-

Company Map Diagram – A Living Presentation for Location Guidance
#Company Introduction #Other #Contact Information
-

Game Development Team Contact Information – Connect with Us
#Company Introduction #Contact Information
-

Smartwatch Development Team Contact Slide – Professionalism and Clarity
#Company Introduction #Contact Information
