Business Promotion Strategy
Construction Industry Future Forecast Graphs and Messages
RJ0900013_20
- Last Update 12/21/2025
- File Size 0.4MB
- # of Slides 2
- File Format PPTX
- Slide Ratio 16:9
- Color
Keywords
About the Product
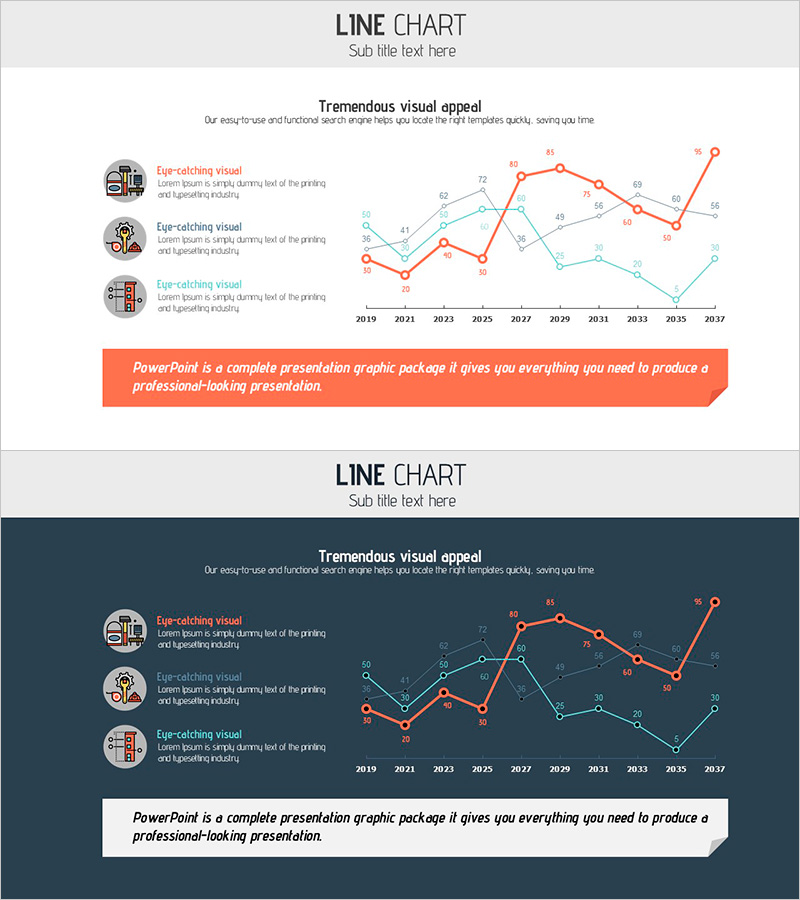
This slide utilizes visually appealing line charts to clearly showcase the future forecasts of the construction industry. The layout allows for effective comparisons of data across different years, with a dominant red and teal color scheme that emphasizes a positive outlook for the future. Infused with the theme of 'growth', this slide is perfect for business strategy presentations and market analysis reports. Each element is easily replaceable, making the editing process straightforward. Use this slide to deliver compelling forecasts to your audience effectively.
Related Products
-

Fantastic Wide PPT Vertical Bar Segmentation Chart – Visualization of Business Strategy
#Business Introduction #Business Promotion Strategy #Graph
-
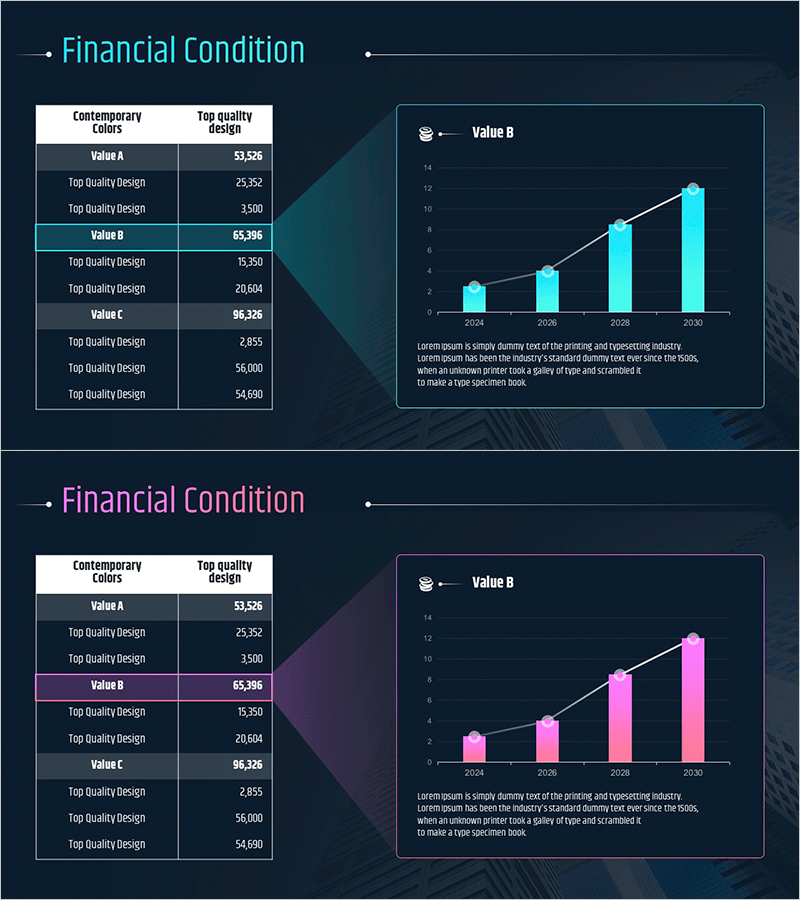
Revenue Growth Analysis Graph & Table - Financial Condition and Data Visualization
#Business Introduction #Diagram #Graph
-
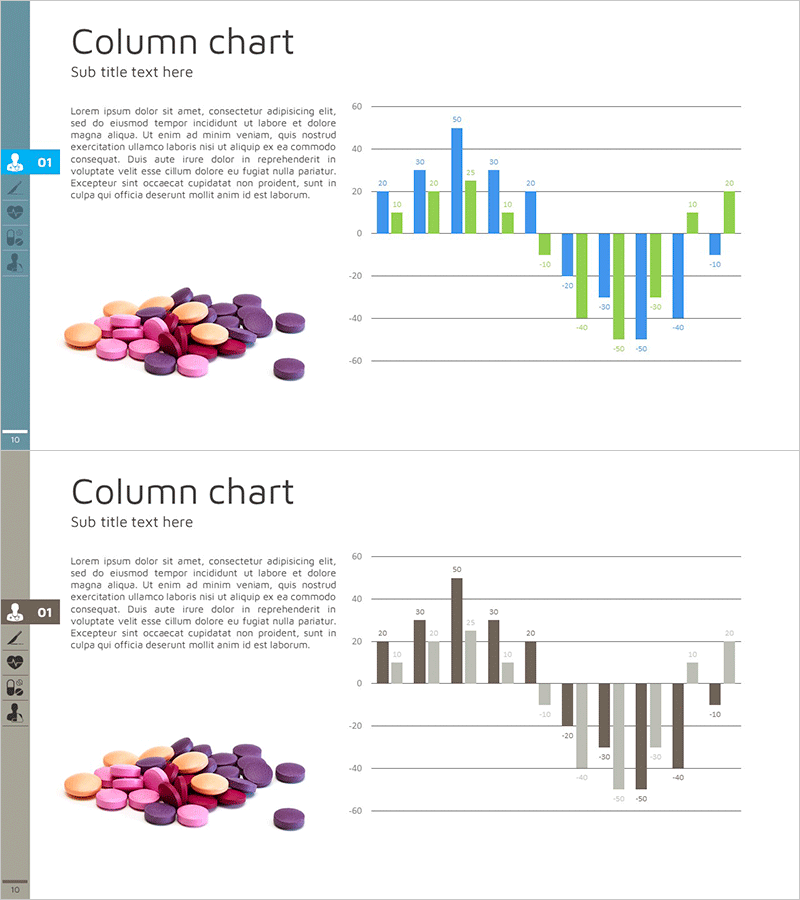
Pill Market Analysis Vertical Bar Graph – Clear Visualization of Market Status
#Market and Competitor Analysis #Graph #Competitor Analysis
-
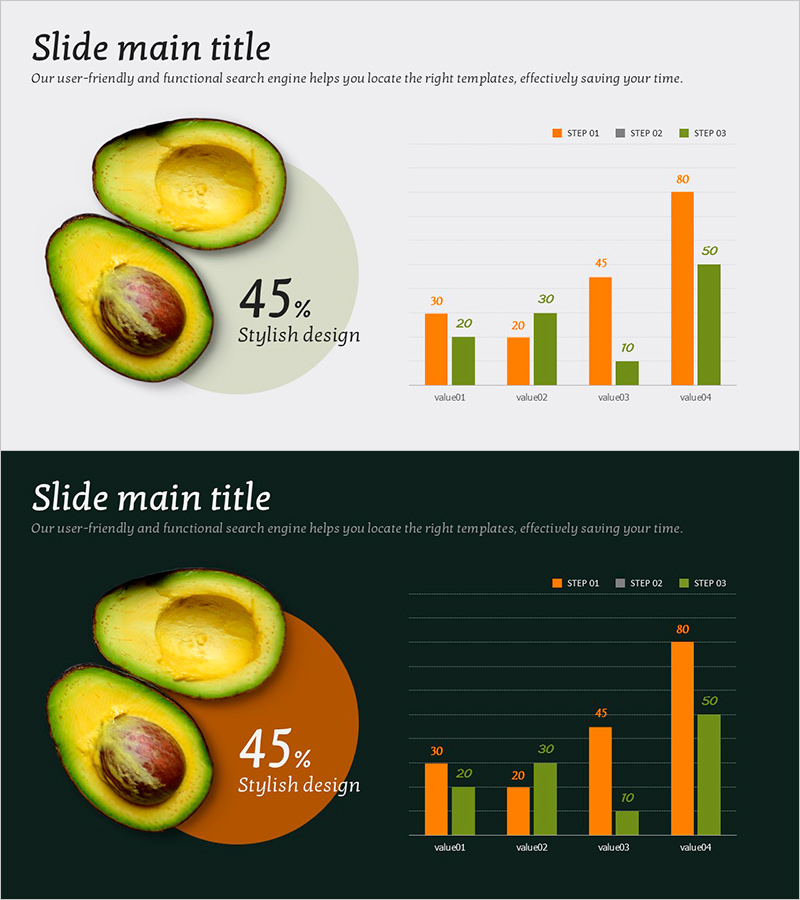
Analysis of Changes in Avocado Purchases with Horizontal and Vertical Bar Graphs
#Market and Competitor Analysis #Graph #Market Status
