Graph
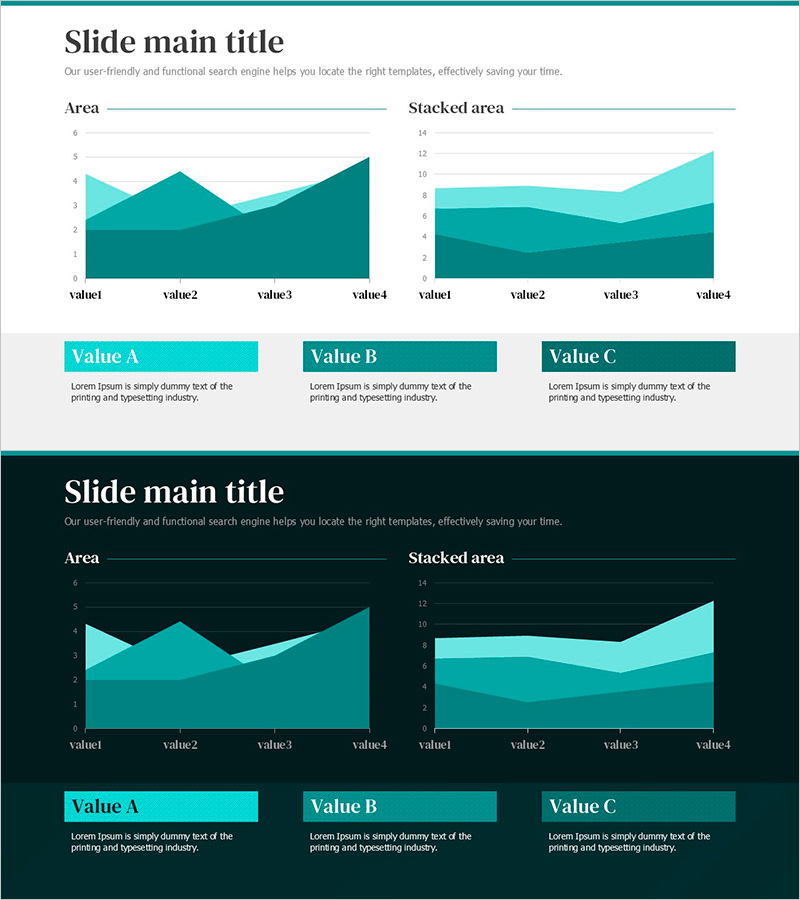
Chart Analysis of Green Areas – A New Approach to Data Visualization
RJ0800050_21
- Last Update 12/21/2025
- File Size 0.3MB
- # of Slides 2
- File Format PPTX
- Slide Ratio 16:9
- Color
Keywords
About the Product
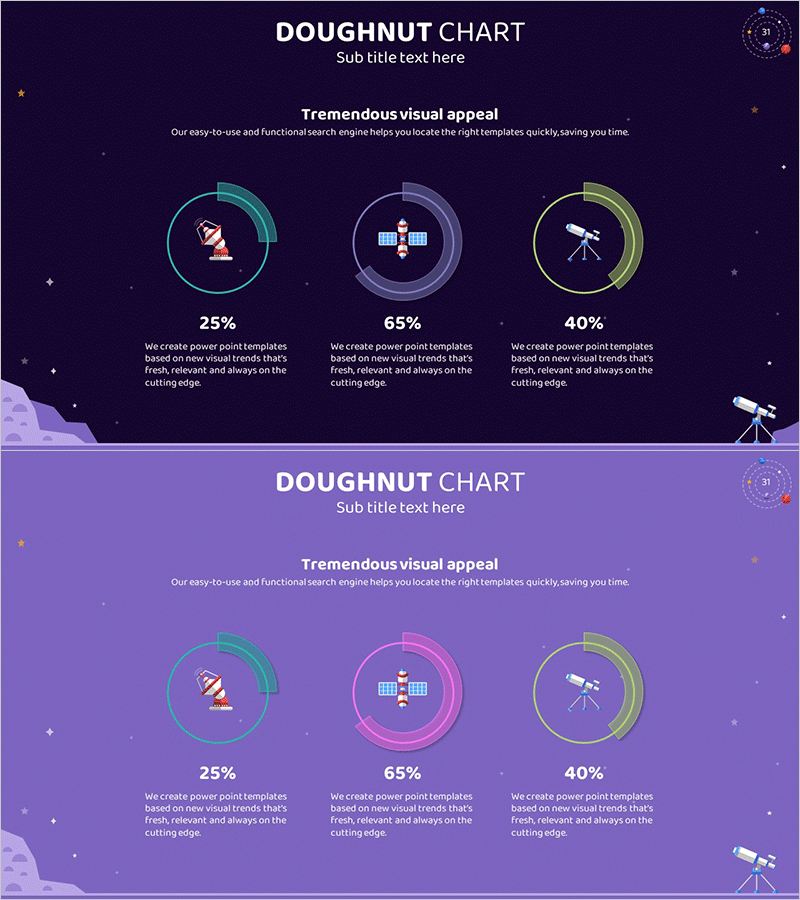
This slide utilizes two types of area charts to intuitively visualize data. The upper and lower sections feature respective charts to enhance visual flow while conveying stability and professionalism through a harmonious blend of green and teal colors. It can be leveraged in various business scenarios such as data analysis results, performance comparisons, and market trends forecasting. This template is particularly useful for investor proposals or research reports.
Related Products
-
Vertical Bar Graph for Market and Competitor Analysis – Professional Data Visuals
#Market and Competitor Analysis #Graph #Competitor Analysis
-
Comparison Bar Graph of Two Topics – Essential Template for Market Analysis
#Market and Competitor Analysis #Graph #Competitor Analysis
-
Effective Bar Chart Template for Sales Analysis
#Graph #Horizontal Bar #Segmented Horizontal Bar
-
Aerospace Industry Development Status Graph
#Product/Service #Market and Competitor Analysis #Graph
