Effective Bar Chart Template for Sales Analysis
RJ0500045_13
- Last Update 06/19/2025
- File Size 0.6MB
- # of Slides 2
- File Format PPTX
- Slide Ratio 16:9
- Color
Keywords
About the Product
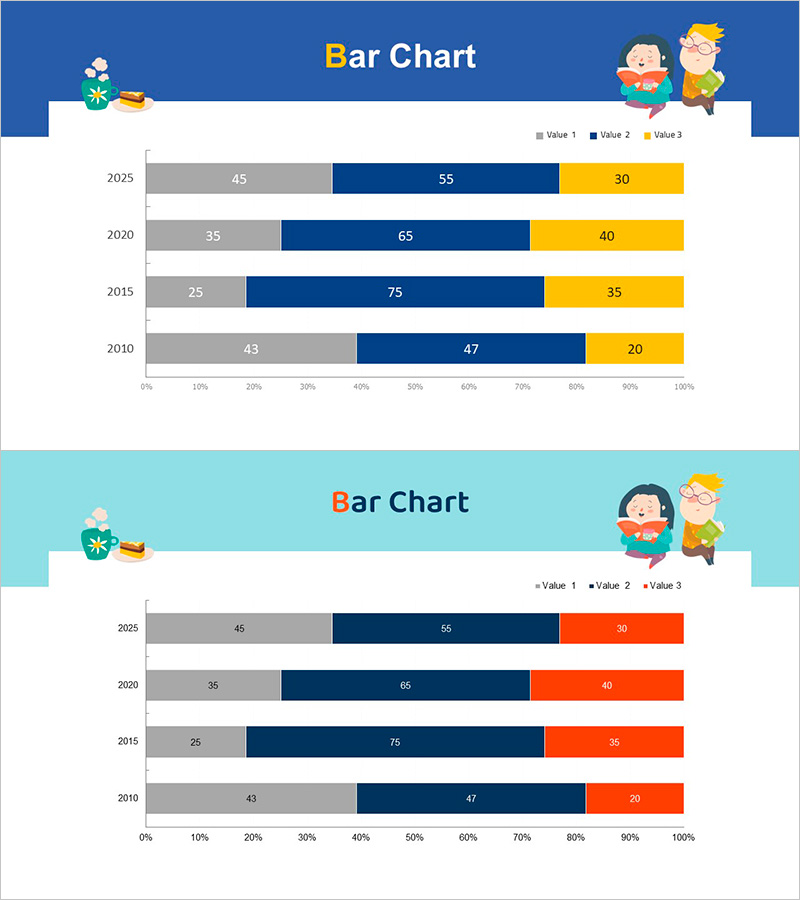
A vertical bar chart PowerPoint slide comparing sales data across three series over four years (2010–2025). The bars are color-coded in gray, navy blue, and yellow to distinguish each data series, with percentage-based horizontal axis and numeric labels for precise analysis. This presentation template is optimized for business reports, investor pitches, and performance reviews where quantitative data comparison is essential. Ideal for displaying year-over-year revenue trends, market share distribution, and departmental performance metrics in professional settings.
Usage Points
-
Main Usage
Compare revenue performance, market share, or departmental metrics across multiple years and categories simultaneously. The three-series structure enables clear visualization of relative performance and trend patterns for data-driven decision-making.
-
How to Use
Apply to quarterly earnings reports, investor presentations, sales performance reviews, and marketing strategy documents. Simply input your data values and the chart updates automatically. Suitable for displaying sales figures, customer satisfaction scores, or regional performance comparisons.
-
Recommended For
Sales teams, marketing departments, finance professionals, and executives preparing performance reports, board meetings, and client proposals. Recommended for any presentation requiring multi-category or multi-year data comparison.
-
Slide Structure
Two-slide set with navy blue header featuring yellow title text and character illustrations. Each slide contains a 4-row (2010, 2015, 2020, 2025) × 3-series horizontal bar structure with 100% stacked comparison layout and numeric labels for each segment.
Related Products
-

Animal Nature Conservation Program Goal Market Strategy Chart
#Business Strategy #Marketing Plan and Strategy #Graph
-

Work and Home Life Graph – Market Trends and Design Sensibility
#Market and Competitor Analysis #Graph #Industry Trends
-

Family Camping Stack Horizontal Chart – Market Status and Competitive Advantage
#Market and Competitor Analysis #Graph #Market Status
-

Horizontal Bar Chart for Changes in the Climbing Population – Market Trend Analysis
#Market and Competitor Analysis #Graph #Industry Trends
