Graph
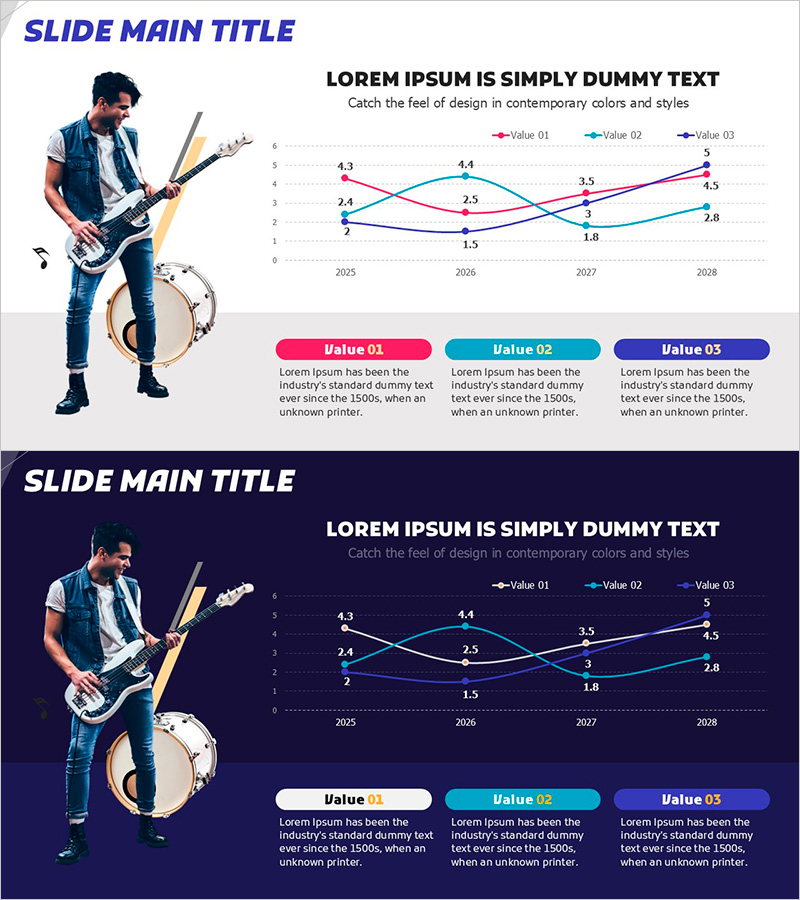
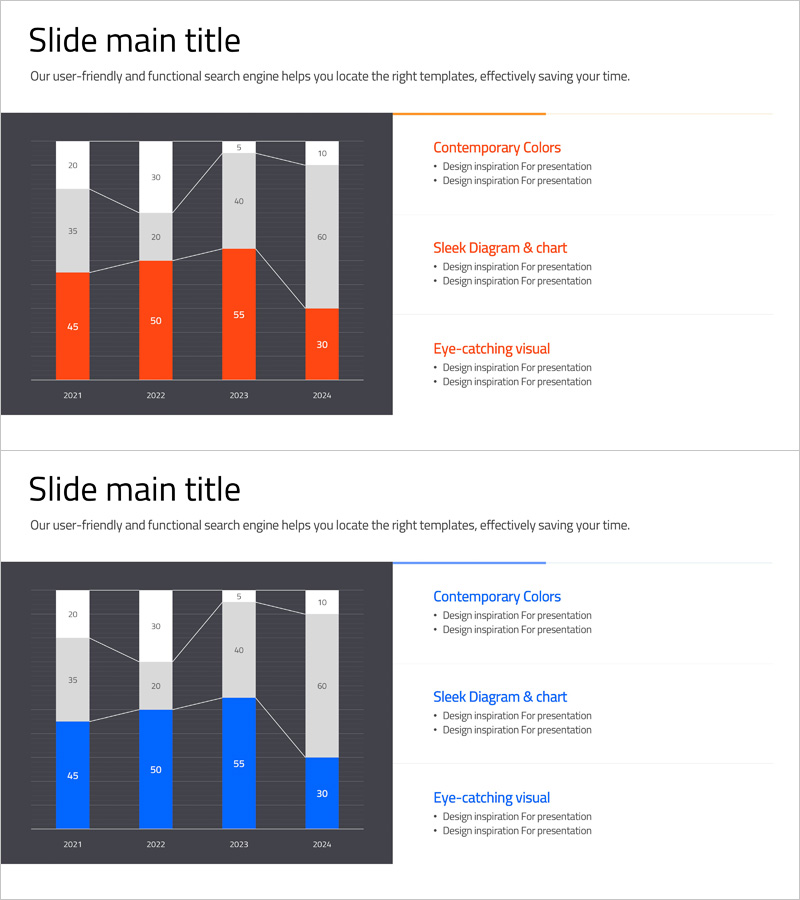
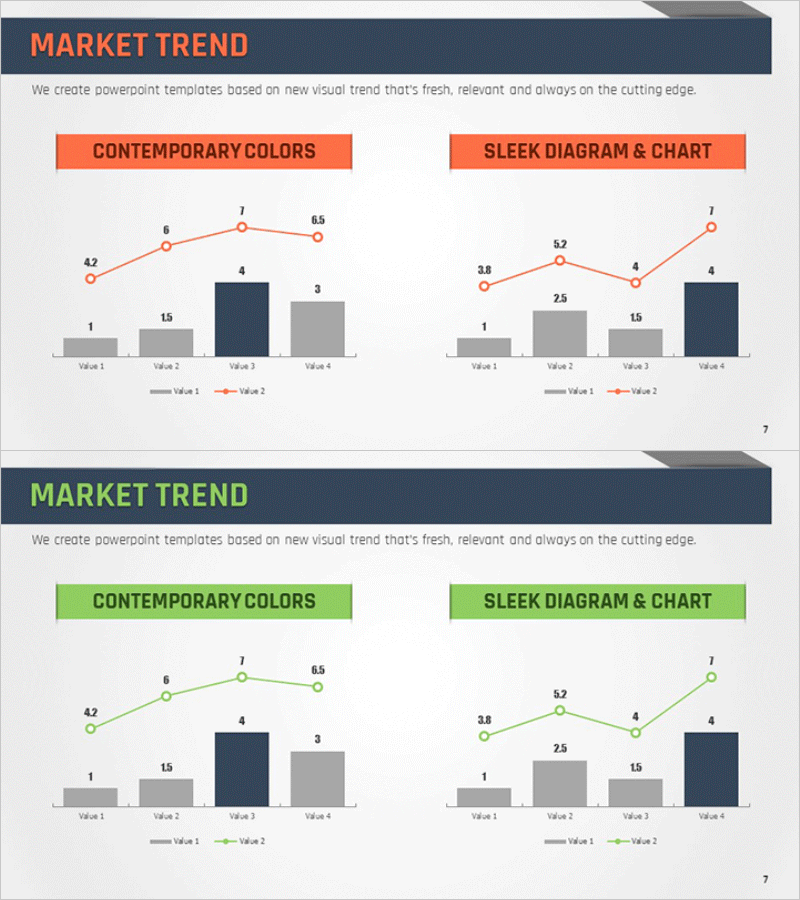
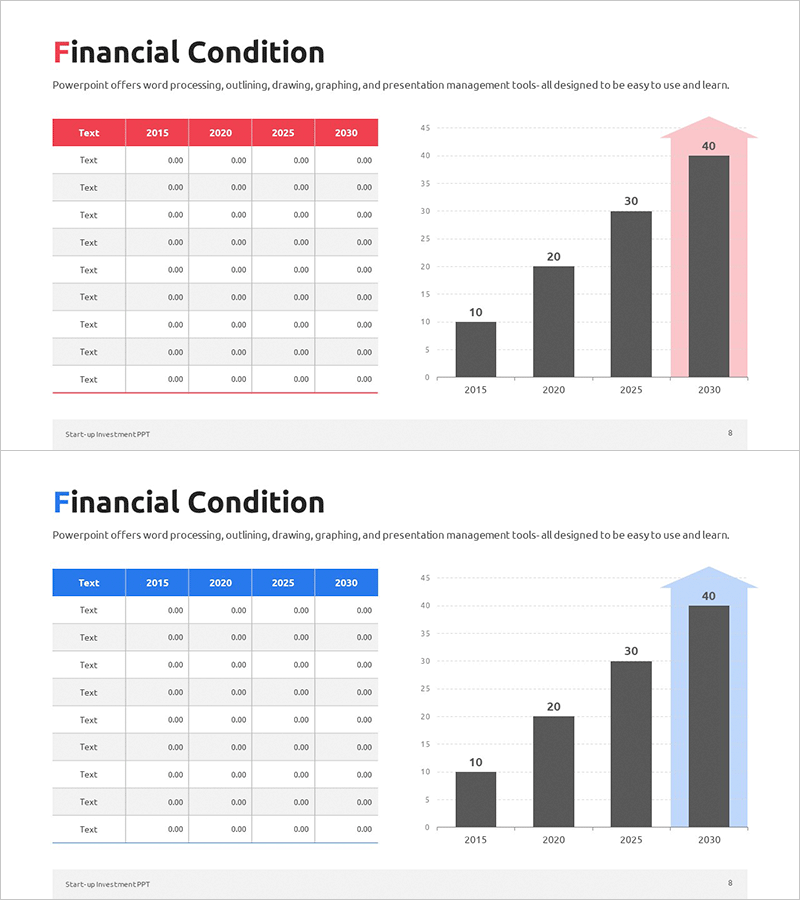
Market Trends Comparison Bar Graph – An Easy Way to Visualize Data
RJ0800041_18
- Last Update 12/21/2025
- File Size 5.6MB
- # of Slides 2
- File Format PPTX
- Slide Ratio 16:9
- Color
About the Product
This slide effectively visualizes market trends using a bar graph in teal, red, and yellow colors. The visual elements are designed for clear data communication, showcasing a user-friendly design. It features a main title at the top for immediate theme conveyance and easily accessible values at the bottom. Ideal for marketing performance analysis, trend presentations, and competitive analyses, this PowerPoint template allows for quick editing and data replacement.
Related Products
-
Business Service Development Status Graph – Data Visualization and Strategic Insights
#Product/Service #Graph #Development Status
-
Analysis Vertical Bar Graph – Market Competitiveness Visualization
#Market and Competitor Analysis #Graph #Competitor Analysis
-
Market Trend Analysis Mixed Chart – Capturing Data and Insights
#Market and Competitor Analysis #Graph #Other
-
Financial Status and Revenue Structure Analysis Chart – Business Insights
#Business Introduction #Market and Competitor Analysis #Diagram
