Technology Sector
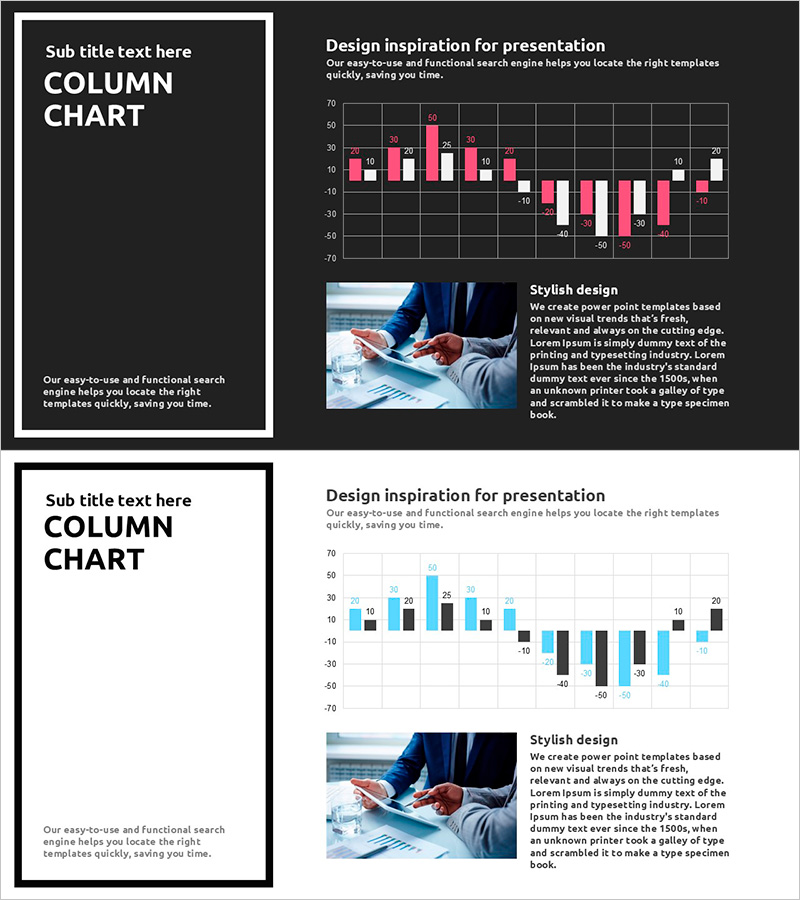
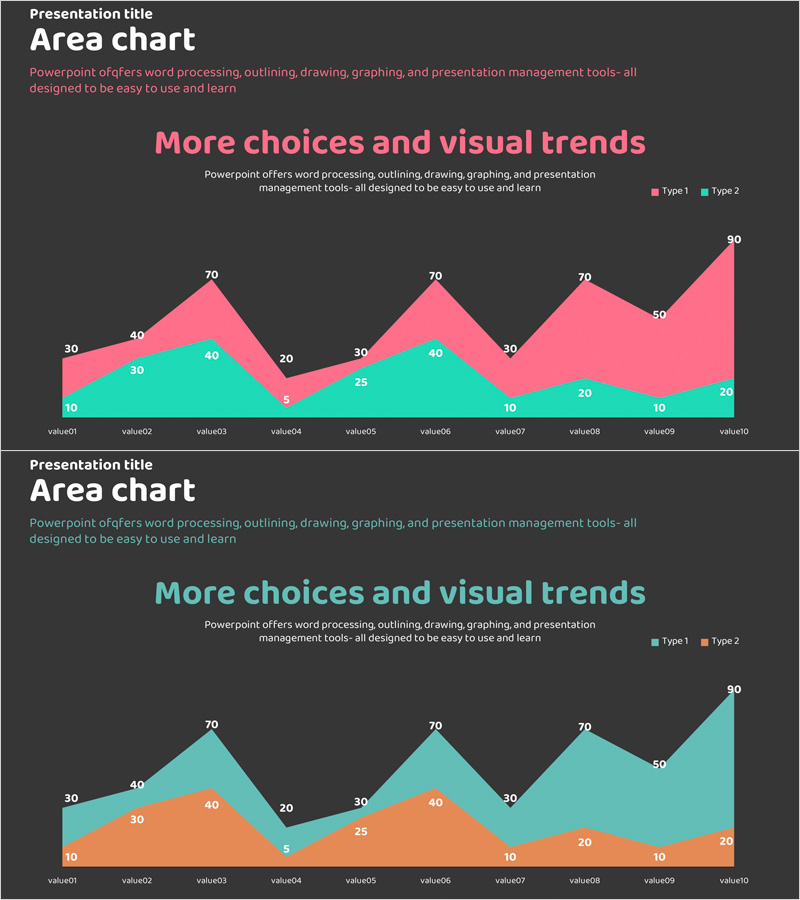
Market Trends Comparison Graph – Emphasizing Technical Advantage
RJ0800036_6
- Last Update 12/21/2025
- File Size 0.3MB
- # of Slides 2
- File Format PPTX
- Slide Ratio 16:9
- Color
Keywords
- #Content-Based Slides
- #Design-Based Slides
- #Technology Sector
- #Market and Competitor Analysis
- #Graph
- #Future Development Direction
- #Competitive Advantage
- #Column
- #Column Chart
- #16:9
- #MarketTrends
- #ComparisonGraph
- #TechnicalAdvantage
- #HorizontalBar
- #VerticalBar
- #TechnologyDivision
- #MarketAnalysis
- #CompetitiveEdge
About the Product
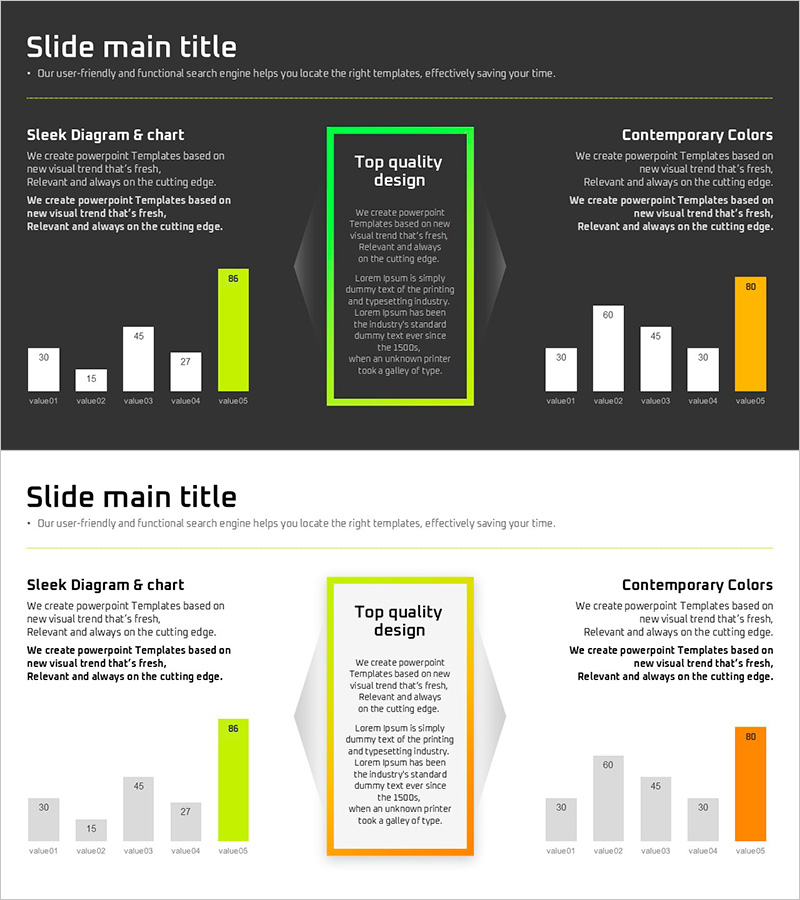
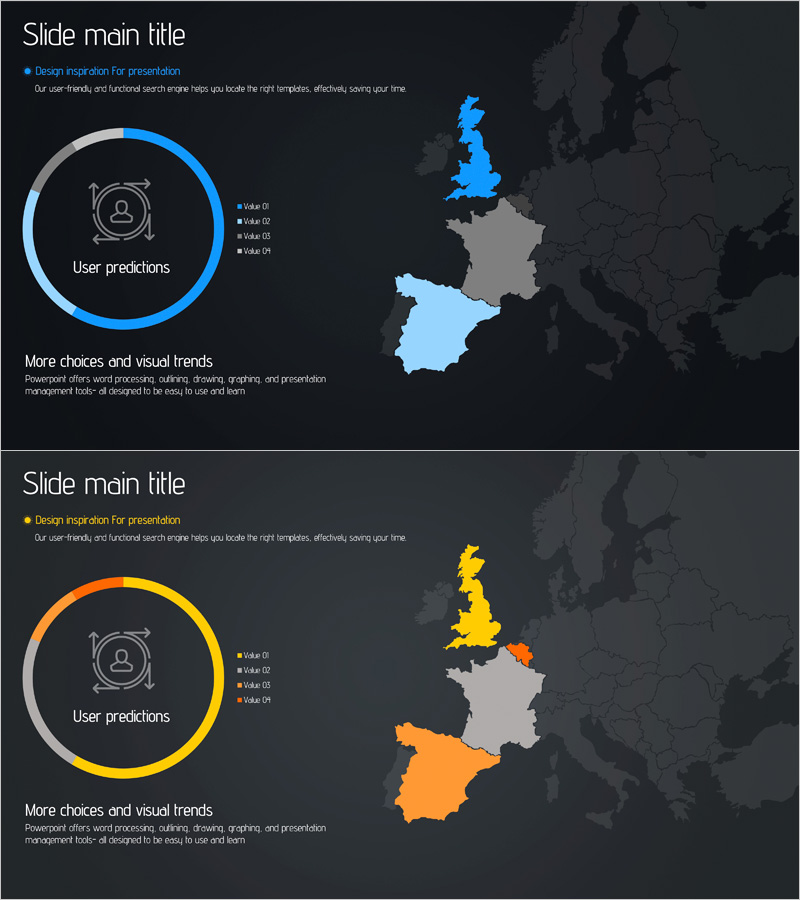
This slide visually presents a comparison graph of market trends, clearly highlighting key data points. Featuring a modern design, it includes both horizontal and vertical bars, making it ideal for market and competitor analysis. The combination of green and coral colors creates a visual balance while enhancing visibility. This slide effectively serves presentations that outline technological sectors and future development directions. Content replacement is straightforward, with an editing difficulty rated as 'easy' for integration into various strategic presentations.
Related Products
-
Sensuous Cloud Presentation Template for Financial Performance Visualization – Business Insight
#Financial Plans and Performance #Graph #Income Statement
-
Target Market Analysis Graph – Visualized Data Insights
#Product/Service #Market and Competitor Analysis #Graph
-
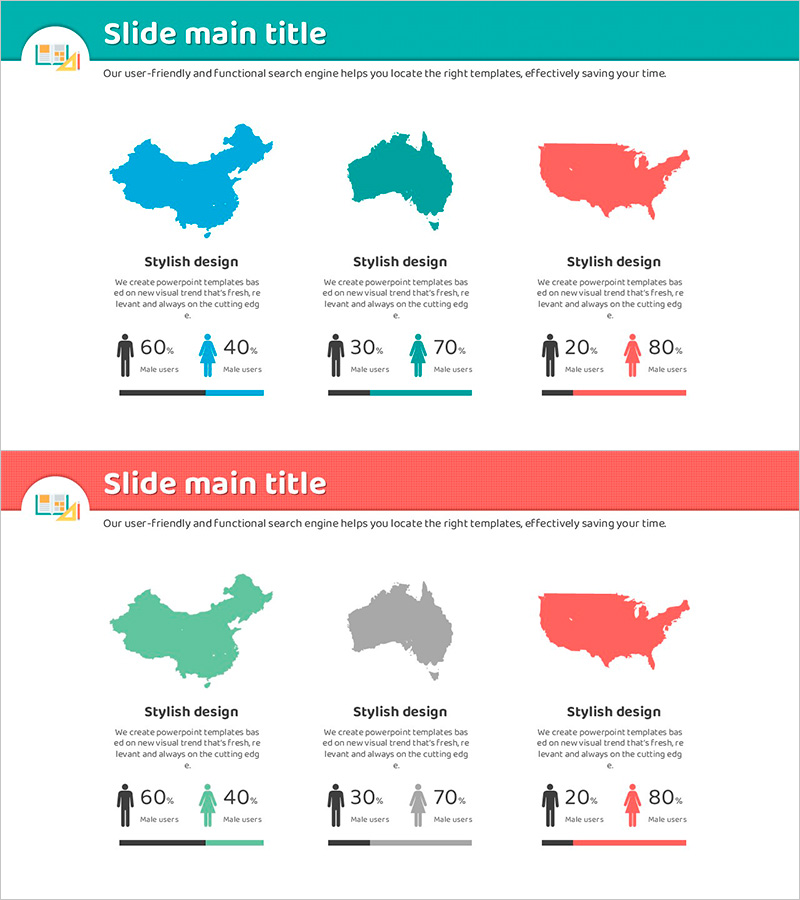
Male and Female Analysis by Country – Insights on Gender Ratio and Market Trends
#Market and Competitor Analysis #Marketing Plan and Strategy #Diagram
-
Graph Slide Visualizing Performance and Future Prospects in Pink and Bluegreen
#Company Introduction #Business Promotion Strategy #Graph
