Male and Female Analysis by Country – Insights on Gender Ratio and Market Trends
RJ0500025_20
- Last Update 06/13/2025
- File Size 0.5MB
- # of Slides 2
- File Format PPTX
- Slide Ratio 16:9
- Color
Keywords
- #Content-Based Slides
- #Design-Based Slides
- #Market and Competitor Analysis
- #Marketing Plan and Strategy
- #Diagram
- #Other
- #Customer Analysis
- #Target Setting
- #Cluster
- #Closed Cluster Diagram
- #16:9
- #world map PowerPoint slide
- #gender ratio analysis
- #country comparison chart
- #demographic data visualization
- #market analysis presentation
About the Product
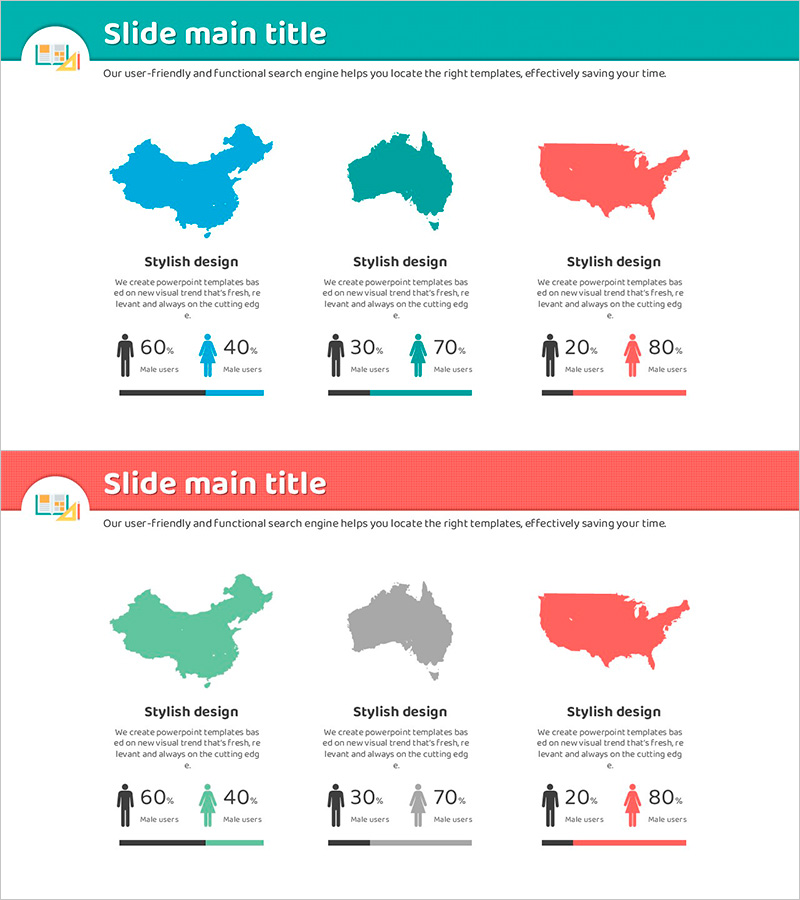
A PowerPoint slide that visualizes gender distribution across countries using world maps and demographic data. This presentation template displays the male-to-female ratio for China, Australia, and the United States through color-coded regional maps and icon-based bar charts, making it ideal for global market analysis. Each country's gender composition is clearly shown as percentages, with teal, green, and coral tones distinguishing regions for easy comparison. Perfect for marketing strategy presentations, customer analysis reports, and market research briefings that require clear demographic insights.
Usage Points
-
Main Usage
Visualize gender distribution patterns across global markets to support demographic-based business decisions. This slide effectively communicates population statistics for customer segmentation, market targeting, and regional expansion strategies in investor pitches and strategic planning presentations.
-
How to Use
Double-click the map regions and bar chart values to edit with your own data. Easily customize country selections, modify colors, and adjust percentages to match your presentation context. Suitable for business reports, marketing plans, and investor presentations requiring demographic analysis.
-
Recommended For
Marketing professionals, market analysts, and business strategy teams preparing global customer analysis materials. Particularly valuable for product development teams, advertising campaign planners, and sales teams presenting region-specific strategies based on demographic insights.
-
Slide Structure
2-slide template featuring three world maps (China, Australia, United States) per slide with corresponding male and female icons and percentage bar charts below each region. Teal, green, and coral color coding maintains visual consistency across regional distinctions.
Related Products
-

PC Mockup and Target Settings – Market Analysis & Strategy
#Market and Competitor Analysis #Marketing Plan and Strategy #Other
-

Human Resources Data Analysis - Effective Customer Management Strategies
#Company Introduction #Market and Competitor Analysis #Diagram
-

Business Insight Through Two Perspectives
#Product/Service Introduction #Market and Competitor Analysis #Diagram
-

Customer Analysis and Target Setting Slide Template - Infographic for Market Understanding
#Market and Competitor Analysis #Marketing Plan and Strategy #Graph
