Target Market Analysis Graph – Visualized Data Insights
RJ0400059_19
- Last Update 06/03/2025
- File Size 1.2MB
- # of Slides 2
- File Format PPTX
- Slide Ratio 16:9
- Color
Keywords
- #Content-Based Slides
- #Design-Based Slides
- #Product/Service Introduction
- #Market and Competitor Analysis
- #Graph
- #Other
- #Development Status
- #Target Market
- #Circles
- #Doughnut Chart
- #Map
- #16:9
- #Europe map PowerPoint slide
- #regional market analysis presentation
- #target market visualization
- #geographic data PowerPoint template
- #how to create market analysis map in PowerPoint
About the Product
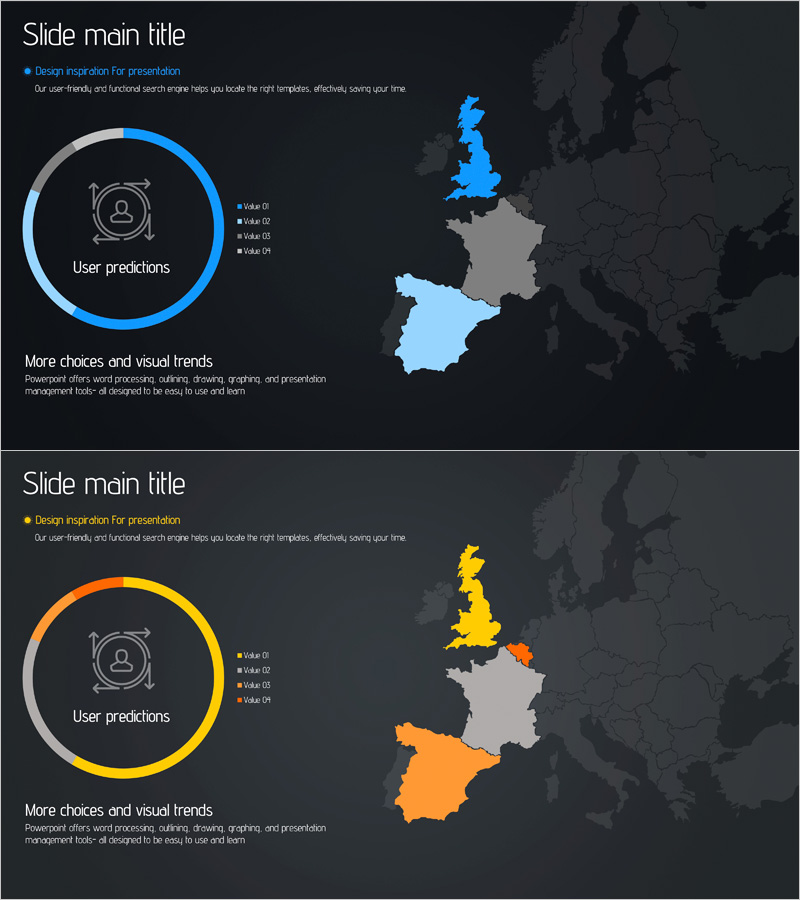
A regional target market analysis PowerPoint slide featuring a Europe map with color-coded country highlighting in blue, orange, and yellow on a dark background. The design combines a circular diagram with legend elements to visualize user predictions and market segmentation data intuitively. This 16:9 format, 2-slide set is ready to use in business presentations, pitch decks, marketing plans, and strategic reports for effective geographic market visualization.
Usage Points
-
Main Usage
Ideal for presenting regional market size, geographic expansion strategy, and customer distribution across European territories. The circular diagram paired with legend elements enables step-by-step explanation of complex multi-regional data and market insights.
-
How to Use
Insert into market analysis sections of business plans, target market definition pages in marketing strategies, and regional expansion slides in investor pitch decks. Customize map colors and legend categories to match your actual regional data and business focus areas.
-
Recommended For
Marketing managers, business development professionals, executives preparing regional reports, and international business teams presenting geographic market strategies. Suitable for global expansion plans, regional marketing campaigns, and competitive landscape analysis presentations.
-
Slide Structure
2-slide set with first slide featuring blue-highlighted Europe map and second slide with orange and yellow regional emphasis. Each slide includes a 4-category circular diagram, 'User predictions' label, legend, and descriptive text area at the bottom.
Related Products
-

Target Country Market Share Analysis Graph
#Market and Competitor Analysis #Graph #Other
-

Slide Visualizing America with Contemporary Colors
#Market and Competitor Analysis #Marketing Plan and Strategy #Graph
-

Donut Chart in Overseas Markets – Market Share Analysis
#Market and Competitor Analysis #Graph #Other
-

Abstract Pattern World Map Template – Harmony of Design and Data
#Market and Competitor Analysis #Financial Plans and Performance #Graph
